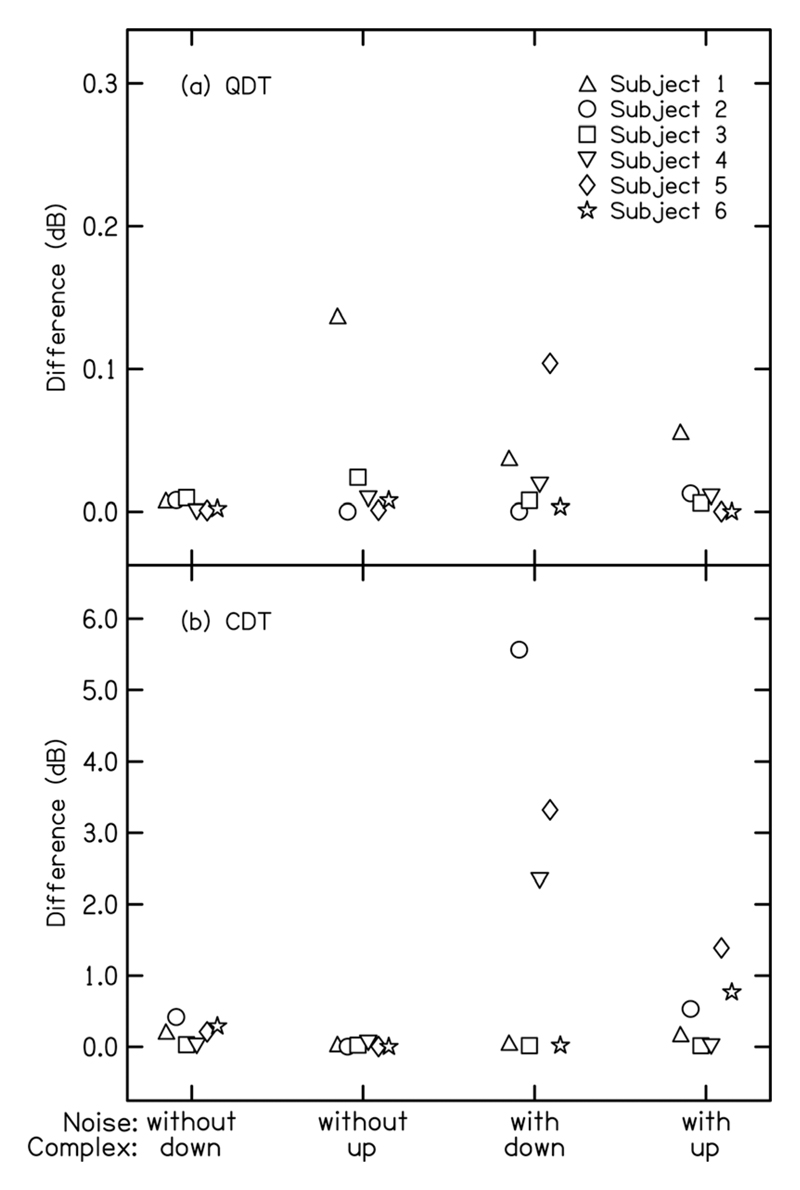
Fig. 2.
Top (a): Peak height (in dB) at the QDT frequency in the averaged spectra of the FFR waveforms for the two polarities minus the peak height at the QDT frequency in the spectrum of the addition waveform. Bottom (b): Peak height (in dB) in the FFR at the CDT frequency in the averaged spectra of the FFR waveforms for the two polarities minus the peak height at CDT in the spectrum of the subtraction waveform. The frequency-shifted complex was presented at 75 dB SPL. The 300-Hz wide noise had an rms level of 85 dB SPL, and was centered on 290 and 310 Hz for the downward- and upward-shifted complex tones, respectively.

