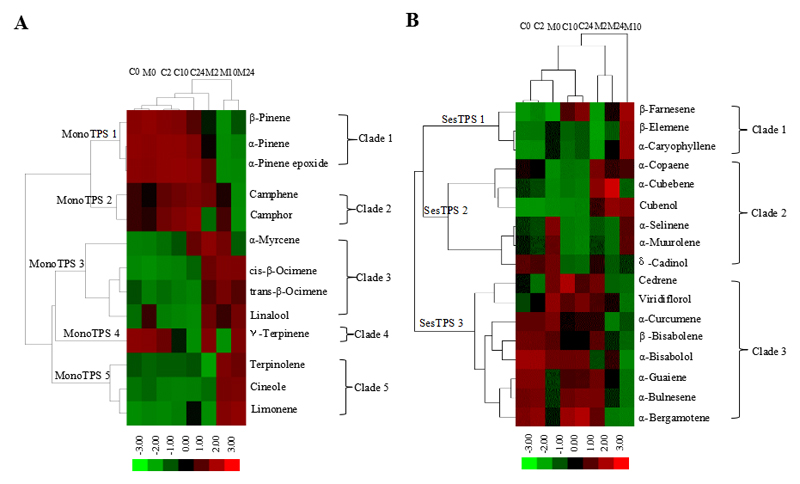
Fig. 7.
Cluster analysis of 13 monoterpenoids (A) and 17 sesquiterpenoids (B) emitted from flowers of O. basilicum. Hierarchical K-means cluster analysis was performed based on the emission rates of monoterpenoids and sesquiterpenoids from the flowers of O. basilicum under control and MeJA treatments at four time steps (20 min, 2 h, 10 h, 24 h), and putative terpene synthases (TPS) were defined. The colour codes denote the changes in the emission rate due to MeJA treatment. Red represents the up-regulation of the emission rate in response to MeJA treatment, while green represent down-regulation.

