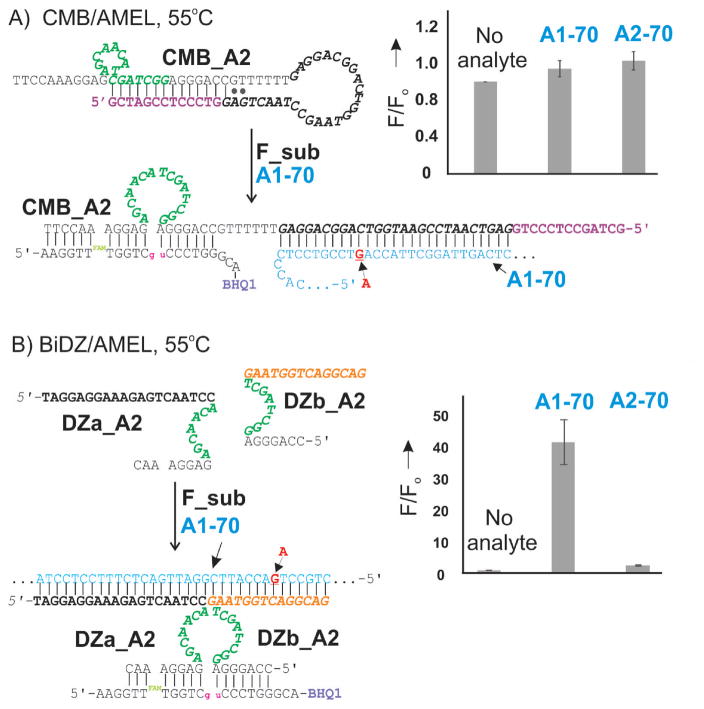
Figure 2.
Predicted structures of probe-analyte complexes and selectivity data for CMB_A2 (A) and BiDZ_A2 (B) recognizing A1–70 analyte at 55°C. For right panels: all samples contained 200 nM F_ sub and either 5 nM CMB or 5 nM DZa_T and 5 nM DZb_T in the reaction buffer. Samples A1 and A2 contained 1 nM complementary A1 and 1 nM mismatched A2 analyte, respectively (for full sequences see Table S1). Fluorescence intensity at 517 nm (emission at 485 nm) was measured after 1 hr of incubation. The data are average values of 3 independent experiments.

