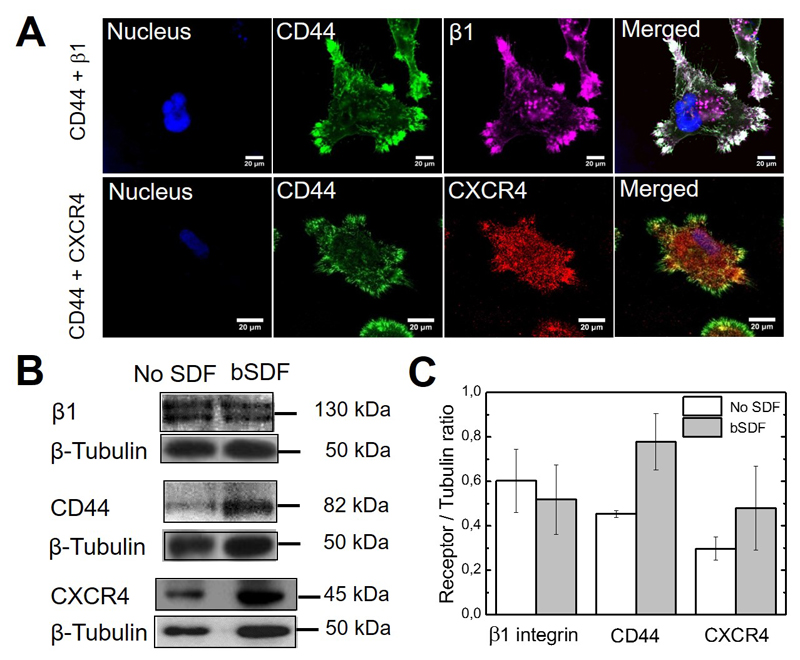
Figure 4.
SDF-1α receptor and cell adhesion receptors staining and expression in response to bSDF. (A) MDA-MB-231 cells were seeded onto the films with bSDF for 16 h. Staining of CD44 (green), CXCR4 (red), β1 integrin (purple) and nuclei (blue) are shown; scale bar: 20 μm; (B) Western blot analysis of CD44, CXCR4 and β1 integrin expression reveals a change in the expression of CD44 and to a lesser extent CXCR4 for bSDF in comparison to the absence of SDF (No SDF). Tubulin was used as a control. The molecular weight of each band is indicated. (C) Quantification of the band intensity from the Western blots for each receptor. The ratio of the receptor/tubulin bands were calculated (n = 3 independent experiments, data are mean ± SD).

