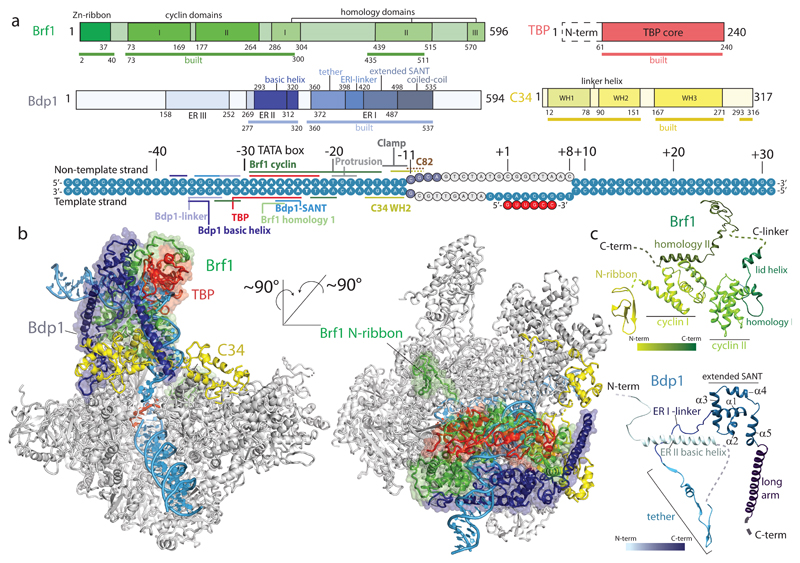
Figure 1. Cryo-EM structure of the Pol III-PIC.
a, Domain organization and conserved regions in TFIIIB and Pol III subunit C34, and DNA transcription scaffold used in this study. Parts of TFIIIB and C34 that are included in the ITC model are underlined and marked as ‘built’. Contacts of TFIIIB and Pol III with the DNA transcription scaffold are indicated. Disordered DNA bases are depicted in light grey. b, Two views of the ITC model. TFIIIB is represented as ribbon and transparent surface, C34 is shown in yellow, other Pol III subunits are colored in grey. c, Ribbon representation of the structures of Brf1 and Bdp1.

