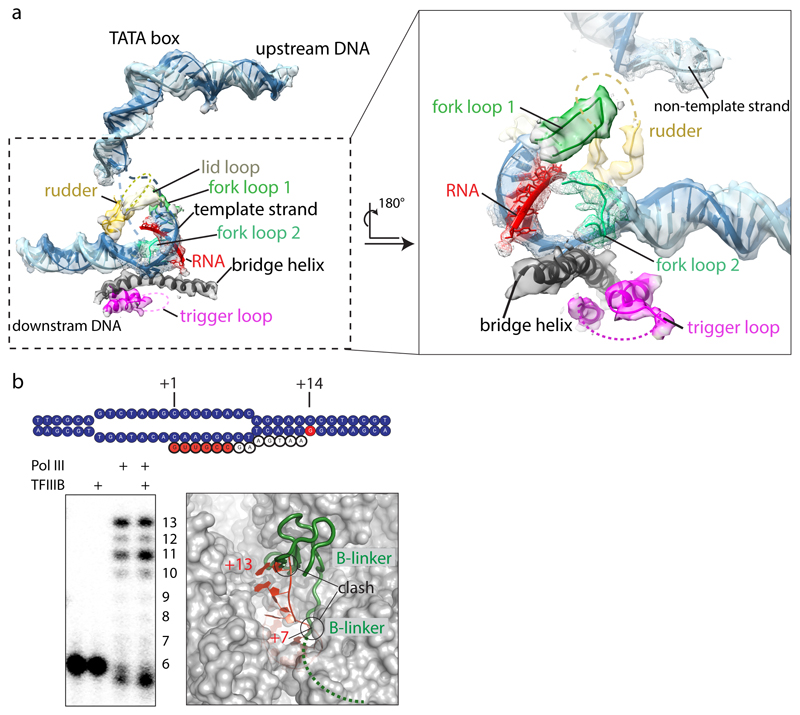
Extended Data Figure 7. Active site and nucleic acid density in the ITC.
a, EM density in the ITC map after amplitude scaling of active site elements and nucleic acids. Elements contoured at a lower threshold are shown as mesh. Active site elements are labelled. The rudder and trigger loops are disordered. Poor density for RNA suggests flexibility or partial occupancy due to dissociation during sample preparation or cleavage by C11. b, RNA extension assay of the 32P-labelled 6-nt RNA in absence of CTP, showing that our preparation is active in transcription using our ITC scaffold. Addition of TFIIIB leads to a stronger accumulation of 11-nt RNA. Modelling of an elongated RNA oligonucleotide based on PDB 5m5x shows that RNA clashes at positions +7 with the beginning of the flexible B-linker, and at position +13 with the B-ribbon. Accumulation of 11-nt RNA in presence of TFIIIB suggests that the RNA in the Pol III-PIC takes a different path compared to the Pol I elongation complex, and clashes with the B-ribbon at position +12, requiring release of TFIIIB to enter elongation. The experiment was repeated three times independently with the same results.

