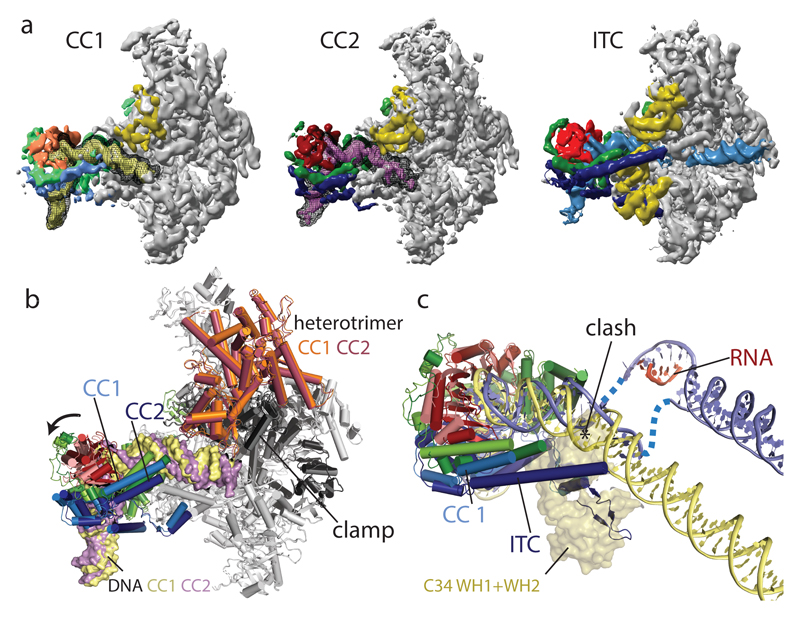
Figure 4. Comparison between Pol III closed complex and open complex structures.
a, EM densities of the CC1, CC2 and ITC with densities corresponding to TBP colored in orange/red, Brf1 colored in green, Bdp1 colored in blue, C34 colored in yellow. CC1 is colored in lighter shades and DNA is colored in pale yellow for CC1 and magenta for CC2. DNA density before B-factor sharpening is shown in addition as black mesh for CC1 and CC2. In the CCs, C34 WH1 and WH2 and the C-terminal part of the Bdp1 coiled-coil helix are disordered. b, Superposition of CC1 and CC2 models shows movement of TFIIIB and the heterotrimer, slightly closing the cleft during the CC1 to CC2 transition. c, Superposition of CC1 and ITC models. DNA for CC1 was further extended with B-DNA to help visualization. The positions of C34 WH1 and WH2 (transparent surface) in the ITC would clash with CC DNA. All models were superimposed on C160.

