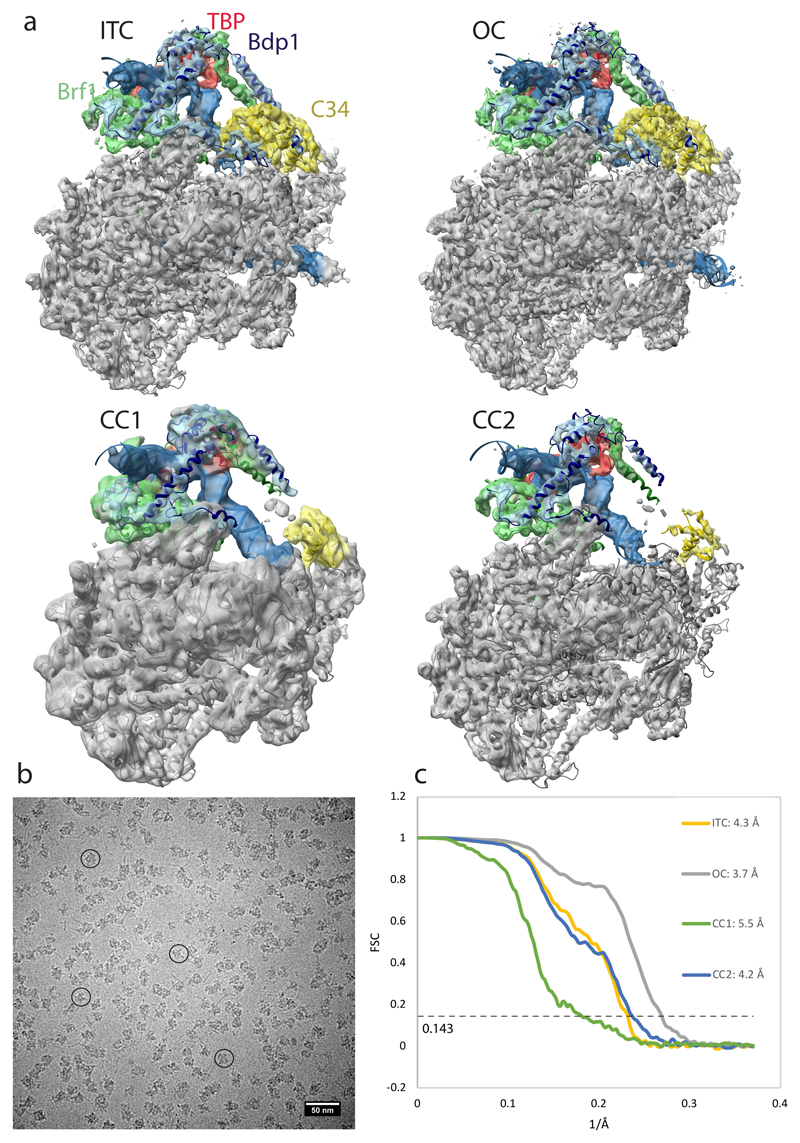
Extended Data Figure 1. Pol III PIC cryo-EM analysis.
a, Cryo-EM densities sharpened with relion_postprocess of the Pol III ITC, OC, CC1 and CC2 maps reported here superimposed with the corresponding models. b, Typical micrograph of the Pol III PIC. c, Fourier-shell correlation (FSC) curves for the different cryo-EM maps as reported by the relion_postprocess program.

