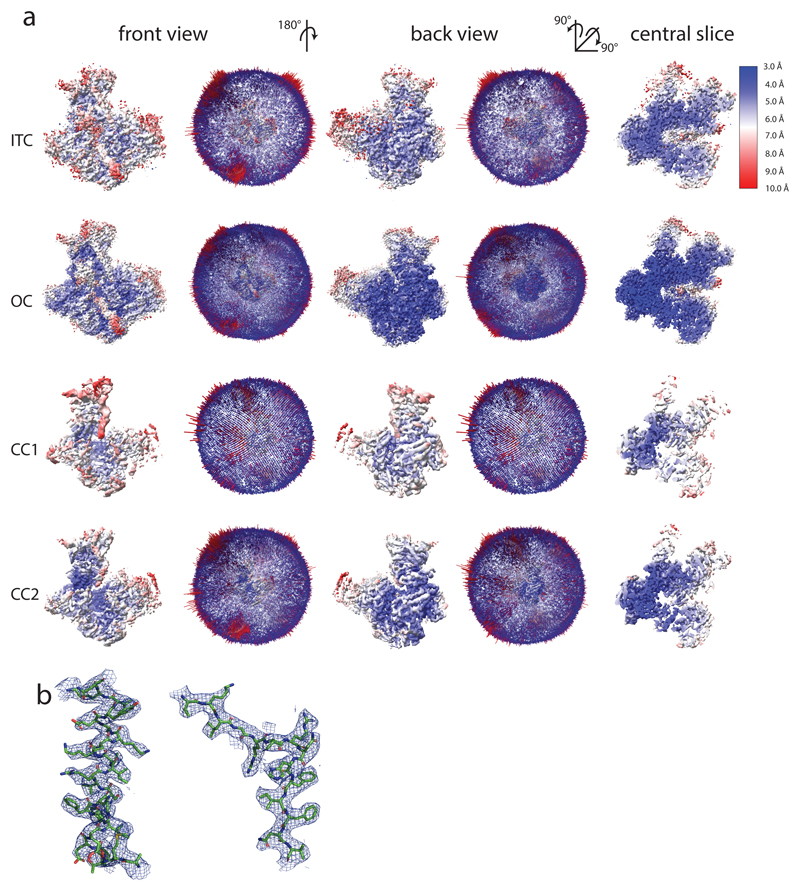
Extended Data Figure 3. Local resolution, Euler angular distribution and side chain densities.
a, Cryo-EM maps colored by local resolution from 3 Å (dark blue) to 10 Å (red). All maps are shown on the same contour level. Central slices show that the local resolution degrades more strongly in the CC2 map compared to the ITC map, although they have comparable overall resolutions. Euler angular distribution plotting shows a good angular coverage without a dominating preferred orientation in all reconstructions. b, Examples of helical and β-strand densities in Pol III subunit AC40 in the 3.7 Å OC map.

