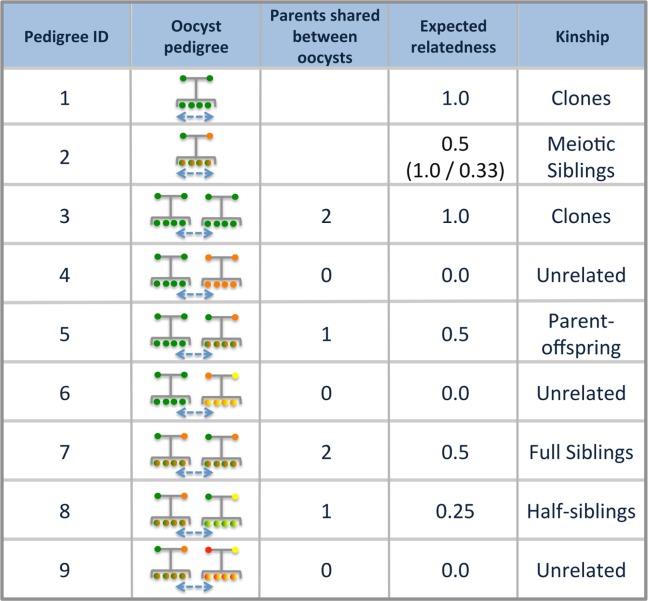
Fig 2. Pedigrees between parasites and their expected relatedness.
The 9 possible pedigrees describing parasite pairs. Pedigrees represent the genetic ancestry of parasites and the oocysts they are sampled from. Circles at the top of each pedigree represent the gametes that fuse and undergo meiosis while circles at the bottom represent the sporozoites that are generated following meiosis and expansion in the oocyst. Different colors represent different genomes. Sporozoites with mixed colors indicate they are the result of outcrossing. Blue arrows between pedigrees indicate that sporozoites are sampled from different oocysts. Parasites can be sampled from the same oocyst (pedigrees 1 and 2) or from multiple oocysts (pedigrees 3–9). For pedigree 2, the distribution of expected relatedness was bimodal, and we provide the average across the entire distribution (top) as well as the two modes (bottom). Pedigree 6 and 8 are only accessible when COI ≥ 3 and pedigree 9 is only accessible when COI ≥ 4.

