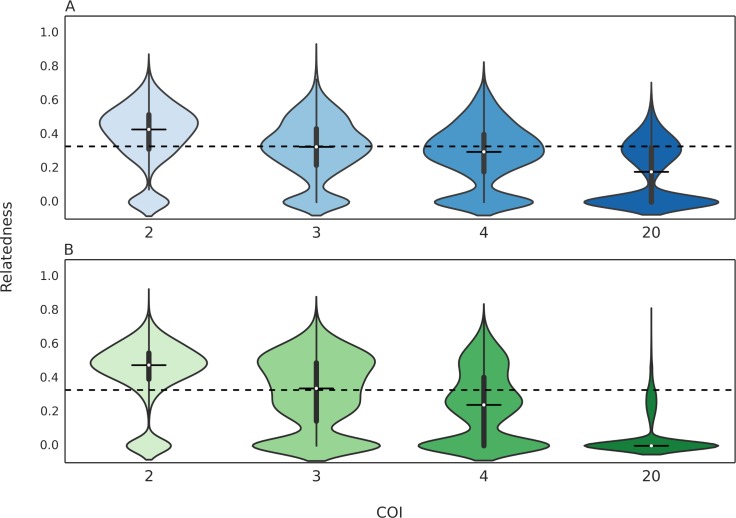
Fig 5. Relatedness of cotransmitted strains in multiple oocyst simulations.
Violin plots of the relatedness of cotransmitted strains in multiple oocyst simulations. Only the results for simulations with oocyst counts of 2 (A) and 20 (B) and infected hepatocyte counts of 2 are shown. The expected relatedness of cotransmitted strains declines with increasing COI. A box plot is drawn in the center of each violin plot, where the white dot represents the median of the distribution, the thicker line represent the interquartile range, and the thinner line represents the whiskers of the box plot, up to 1.5 times the interquartile range. The horizontal dotted line represents the value of 0.33.

