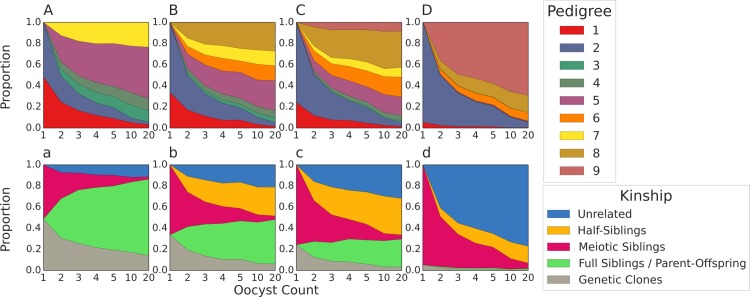
Fig 6. Pedigree and kinship frequencies from multiple oocyst simulations.
Stacked line charts of the frequencies of different pedigrees (A-D) and kinships (a-d) plotted against oocyst count. Each subplot represents a scenario with a different COI (A/a = 2, B/b = 3, C/c = 4, D/d = 20). Only the results from simulations where infected hepatocyte count = 10 are shown. Genetic clones are defined as those emerging from oocysts characterized by pedigree 1 and 3; genetically identical meiotic siblings are still classified as meiotic siblings in this graph.

