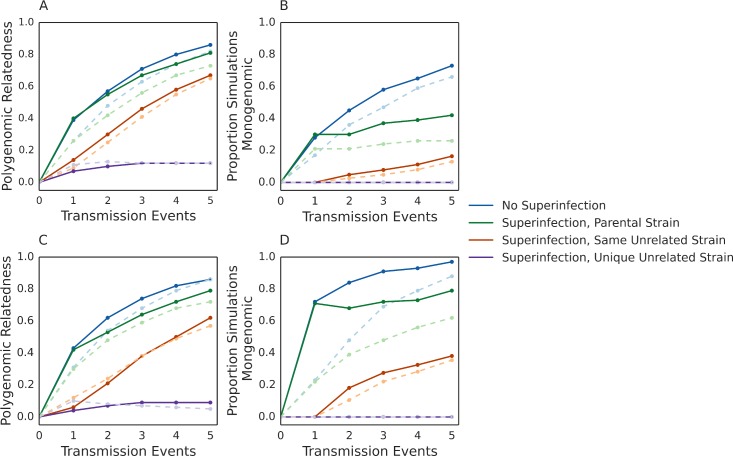
Fig 7. Relatedness of polygenomic infections after multiple transmission events.
Line plots of the average relatedness of polygenomic infections (A,C) and proportion of simulations that have converged to the transmission of a single strain after multiple transmission events across 500 simulations (B,D). Only results from simulations where gametocyte-sampling probabilities are equal (A,B) and where gametocyte sampling probabilities are skewed by a 10:1 ratio between the most frequent and least frequent strain (C,D) are shown. Blue = No superinfection. Green = Superinfection where the resident strain is the same as one of the parental strains in the initial infection. Red = Superinfection where the resident strain is unrelated to the parental strains in the initial infection. Purple = Superinfection where the resident strain is unrelated and different in each transmission event. Solid dark lines indicate results where the initial polygenomic infection had a COI = 2 and light dotted lines indicate results where the initial polygenomic infection had a COI = 5.

