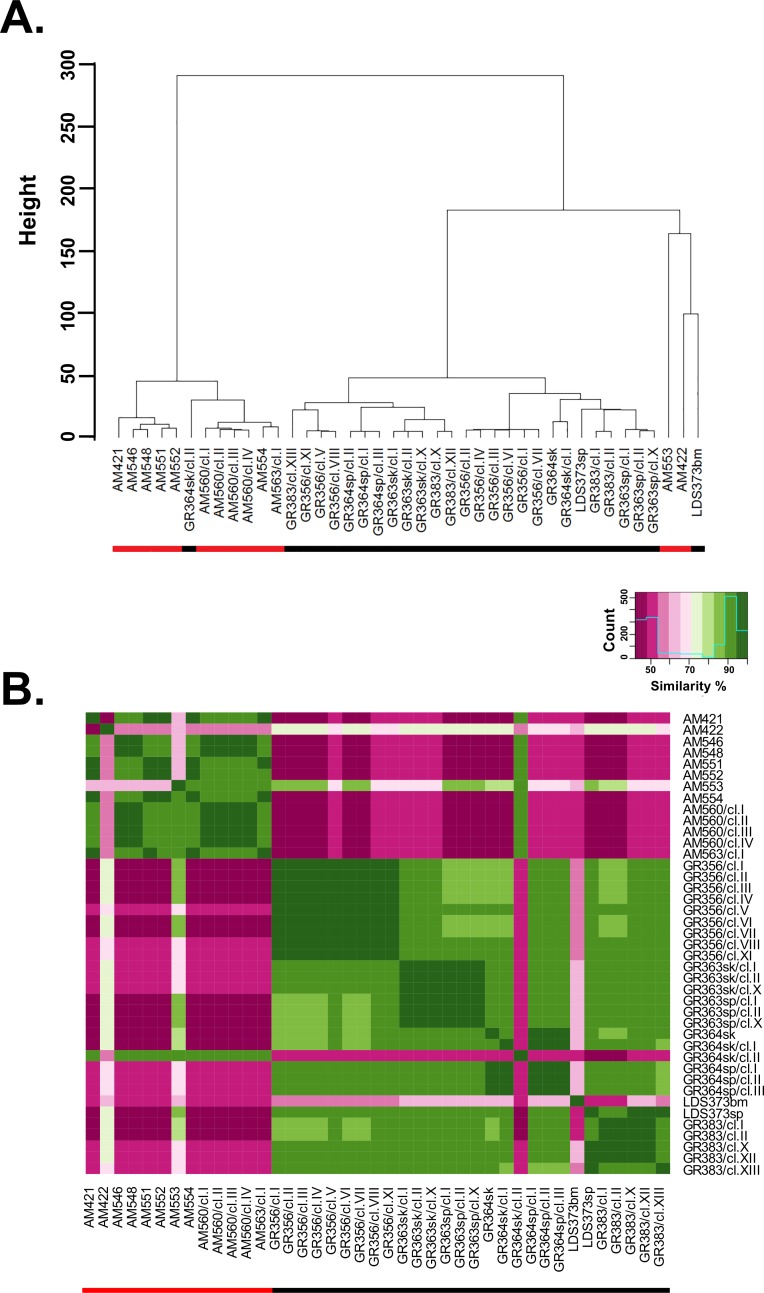
Fig 2. Phylogentic tree and similarity analysis based on SNP.
Panel A. Cluster analysis based on Euclidian distance between SNP similarity profiles among all 41 NE (black bar under name) and SE (red bar under name) lines. The resulting phylogenetic tree describes the genetic diversity among Ethiopia isolates within the two main Leishmania populations. B. Comparison between SNP profiles of Leishmania donovani strains and clones from northern and southern Ethiopia. Heat map allows visualization of similarities between all SNPs from SE and NE strains and clones. Each colored square in the matrix indicates the percent SNP similarity for a strain/clone listed on the right compared to strain/clone listed along the bottom of the matrix. The heat map was generated with R packages; stats and gplots. The green range indicates on identity level ≥ 70% and the pink < 70%. Darker green/pink point to higher or lower identity, respectively.

