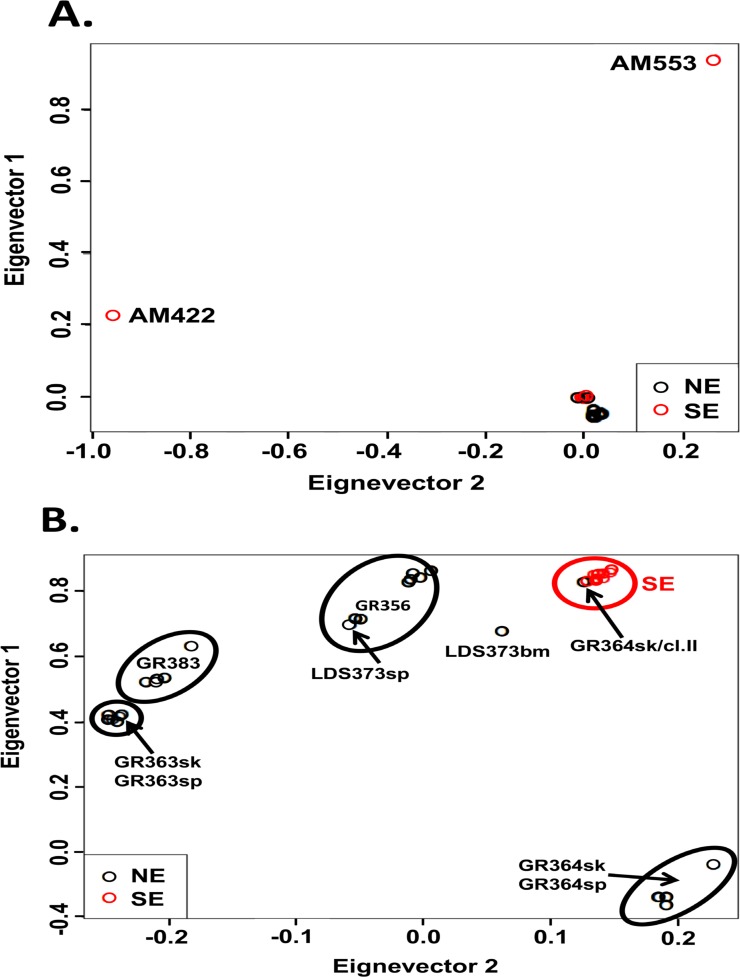
Fig 3. Principal component analysis (PCA) based on SNP of Leishmania donovani NE and SE lines.
PCA analysis was performed after pruning SNPs showing high linkage disequilibrium (LD). SNPs with LD>0.9 are not included. Panel A. PCA of all 41 NE and SE lines. The two atypical SE parasites, AM422 and AM553, fall in eigenvectors 1 and 2 relatively far from both populations (EV1 = 0.229 EV2 = -0.954 and EV1 = 0.945 EV2 = 0.265, respectively). Two NE parasites, GR364sk/cl.II and the atypical LDS373bm, fall with the SE population. Despite the short distance between typical SE (red circles) and NE (black circles) population, these two populations are physically well defined. Panel B. PCA of 39 NE and SE lines without atypical SE strains. The typical SE population (red circles) is very homogenous and falls in a tight cluster unlike the NE population, which is very heterogeneous but still distinct from the SE population. LDS373bm falls equidistance between the SE population and LDS373sp both isolated from the same patient. Line GR364sk/cl.II still clusters together with the SE population (black circle on the middle of the SE cluster). Interestingly lines from spleen and skin taken from the same patients (GR363sp and sk; and GR364 sp and sk) are clustered together and create a well-defined population.

