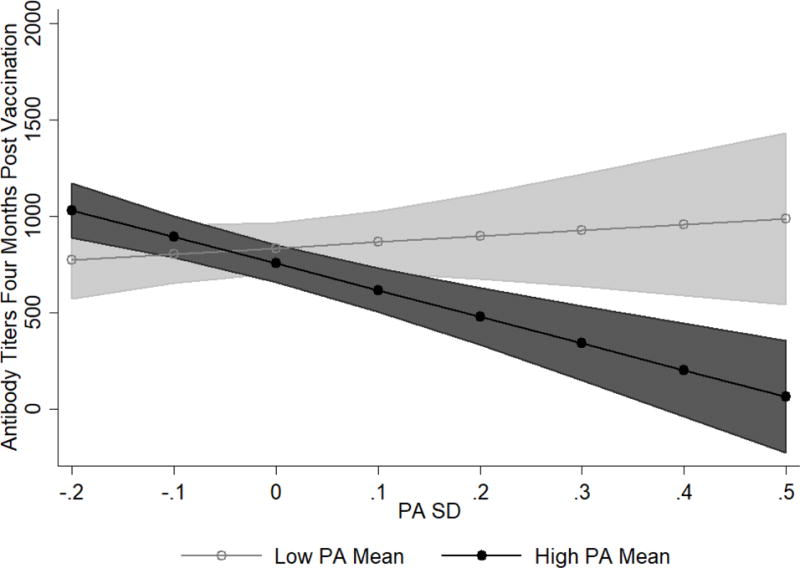
Figure 3.

PASD and PAMEAN interaction on antibody (Ab) titers at four months post-vaccination. Low PAMEAN is one SD below the mean on PAMEAN while high PAMEAN is one SD above the mean on PAMEAN. Lines represent adjusted predictions. Shaded regions are the 95% confidence intervals around the predictions. Regions of PAMEAN (low vs. high) that do not overlap are significantly different from one another in terms of the predicted Ab level. Possible predicted values are between 0 and 1024 titers. However, confidence intervals exceed this range.
