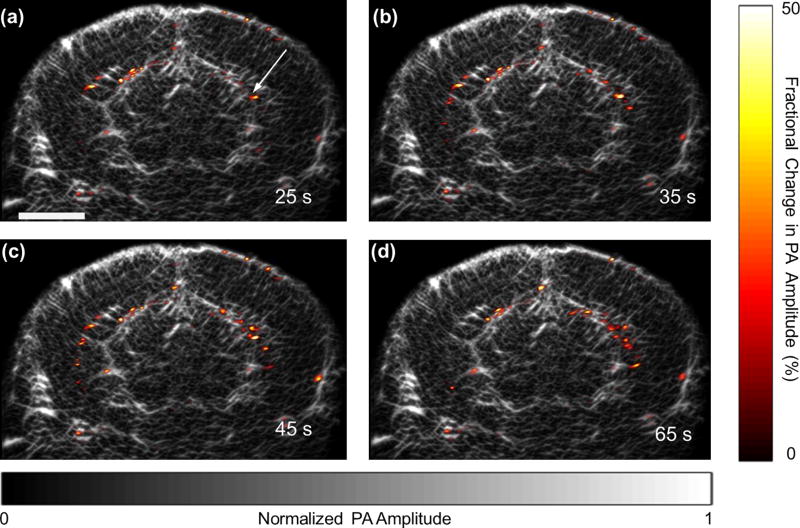
Fig. 4.
Epileptiform activities of a mouse brain during a seizure, as imaged by PACT. The fractional changes in the PA amplitude at different times after the injection of 4-aminopyridine solution are superimposed on the anatomic image (Bregma –1.0 mm). The scale bar is 2 mm, and the arrow indicates the injection site.

