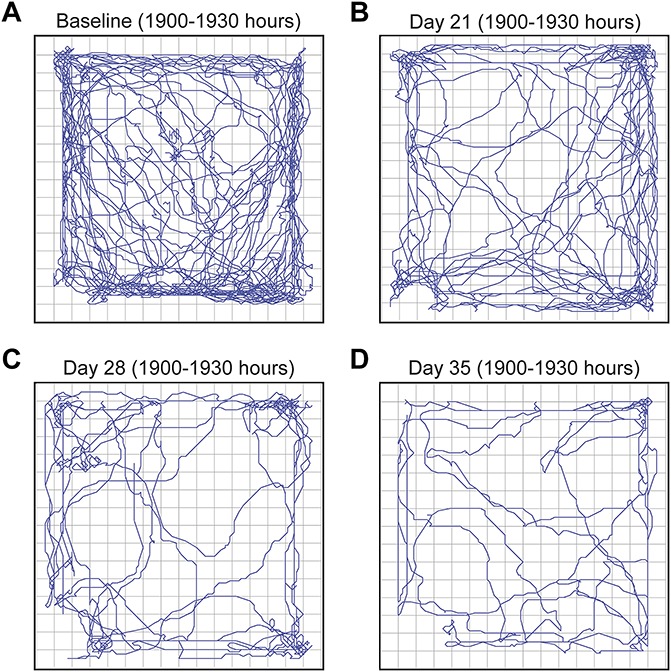
Figure 3.

Representative tracings from a single animal showing the decline in nighttime horizontal activity with disease progression. These tracings were obtained from a single mouse at baseline (7 days prior to tumor injection) and at days 21, 28, and 35 post-tumor injection. The tracings were obtained over 30-minutes (1900–1930 hours) of nighttime, which is normally when mice display the greatest spontaneous activity. Note that horizontal activity continues to decline with disease progression.
