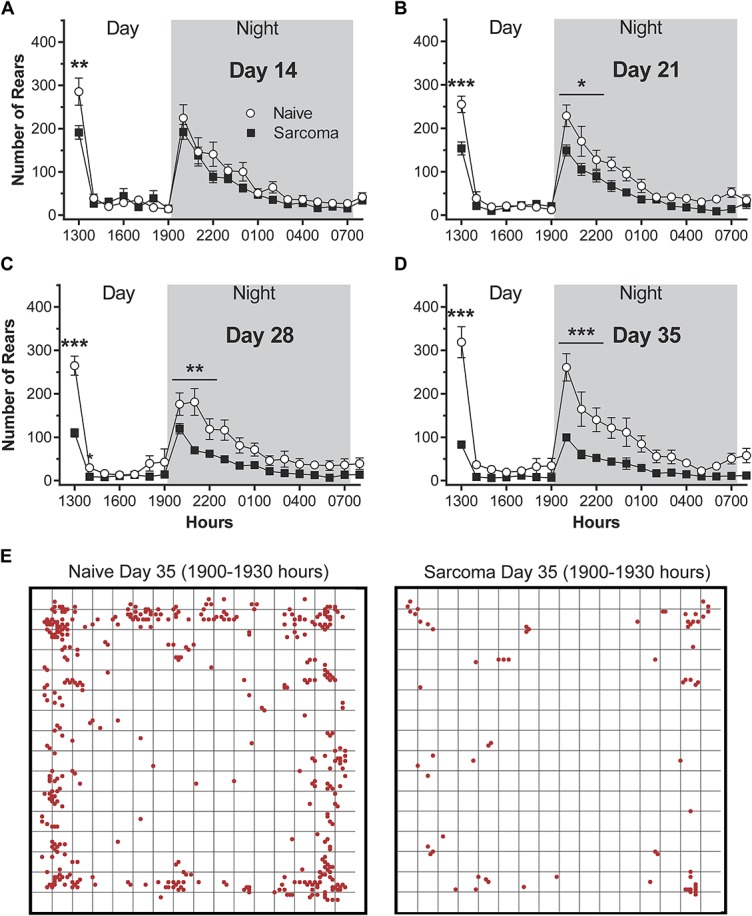
Figure 4.

The number of hindlimb rearing episodes declines with bone cancer disease progression. These data were obtained by recording activity (A–D) for 20 hours, from 1200 (noon) to 0800 hours the following morning under a 12 hours light/dark cycle (0700–1900 hours light and 1900–0700 hours dark). Note that the times during the day/night where there are the largest differences between naive vs bone cancer animals are when the animals are normally the most active, ie, immediately following placement of the mice in the activity boxes (1200–1300 hours) and the first 3 hours of dark (1900–2200 hours). For (A–D), significant differences for the areas under the time-effect curves for the initial exploratory hour (1200–1300 hours) and the first 3 hours of night activity (1900–2200) are indicated by *, **, *** = P < 0.05, 0.01 and 0.001, respectively. Images in E are examples of both the number of episodes and where they occurred during 1900 to 1930 hours on day 35, naive and animals with bone cancer.
