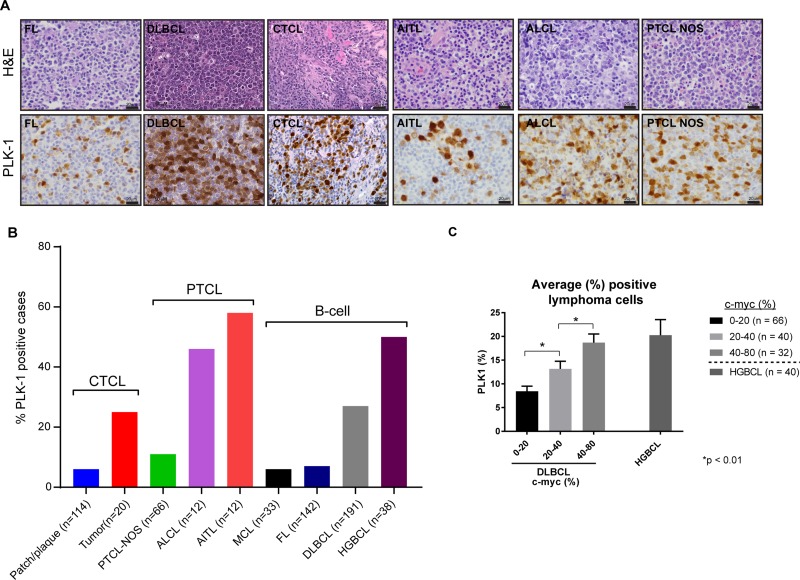
Figure 3.
(A) (Left) Representative images of PLK-1 expression (lower panel) in selected cases of B-cell lymphomas (follicular lymphoma – FL and diffuse large B-cell lymphoma – DLBCL), cutaneous T-cell lymphoma (CTCL), and peripheral T-cell lymphomas (angioimmunoblastic T-cell lymphoma- AITL, anaplastic large cell lymphoma – ALCL and peripheral T-cell lymphoma non-otherwise specified – PTCL NOS). Upper panel show corresponding hematoxylin and eosin (H&E) stains for each case. (B) Graphic representation of the percentage of cutaneous T-cell lymphoma (CTCL), peripheral T-cell lymphomas (PTCL) and B-cell lymphomas (B-cell) positive for PLK-1. The number of nuclei expressing PLK-1 was determined and a z-score of 1, corresponding to ≥20% of nuclei, selected as the optimal cut-off. Cases with ≥40% c-myc expression were scored positive, as previously described [13]. (C) Graphic representation of the average percentage of lymphoma cells expressing PLK-1. DLBCL cases were divided into three groups according to the percentage of c-myc positive lymphoma cells observed by immunohistochemistry. Cases of high grade (“double hit”) B-cell lymphomas (HGBCL) are also included.

