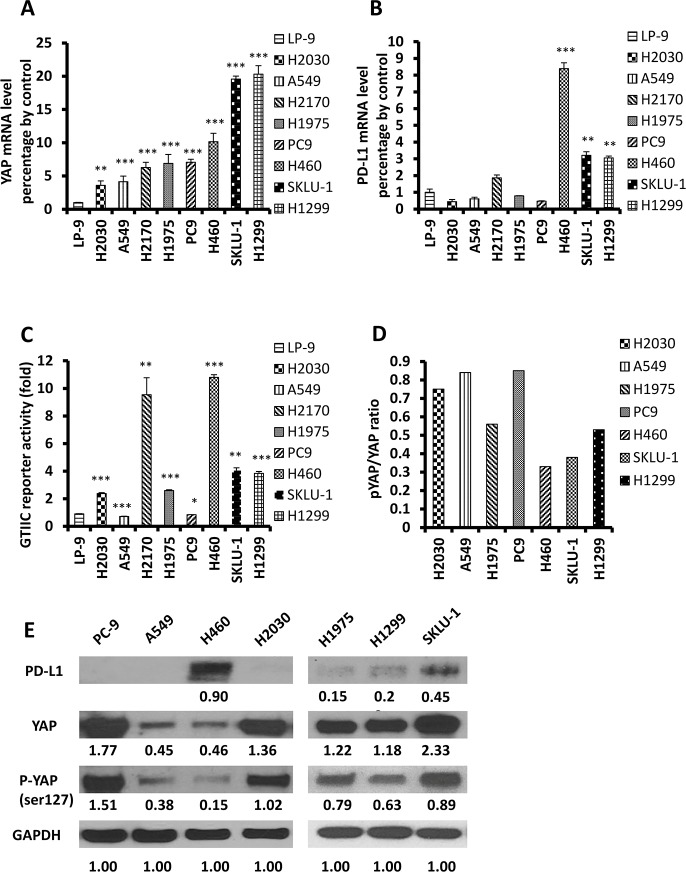
Figure 2. Expression of YAP and PD-L1 in NSCLC cell lines.
(A–B) The mRNA levels of YAP and PD-L1 in NSCLC cell lines were measured using qRT-PCR, and LP-9 cell line was used as control (F = 174.10 P < 0.001; F = 635.77 P < 0.001). VS LP-9: *P < 0.05, **P ≤ 0.01, ***P ≤ 0.001. (C): GTIIC reporter activity of the Hippo pathway in NSCLC cell lines, and LP-9 cell line was used as control (F = 311.39; P < 0.001). VS LP-9: *P < 0.05, **P ≤ 0.01, ***P ≤ 0.001. (D) pYAP/YAP ratio in NSCLC cell lines based on the value of Western blot. (E) Western blot was used to detect levels of YAP, pYAP and PD-L1 in NSCLC cell lines. GAPDH was detected as a loading control. Band intensity was analyzed with ImageJ software and normalized with the intensity of GAPDH band.

