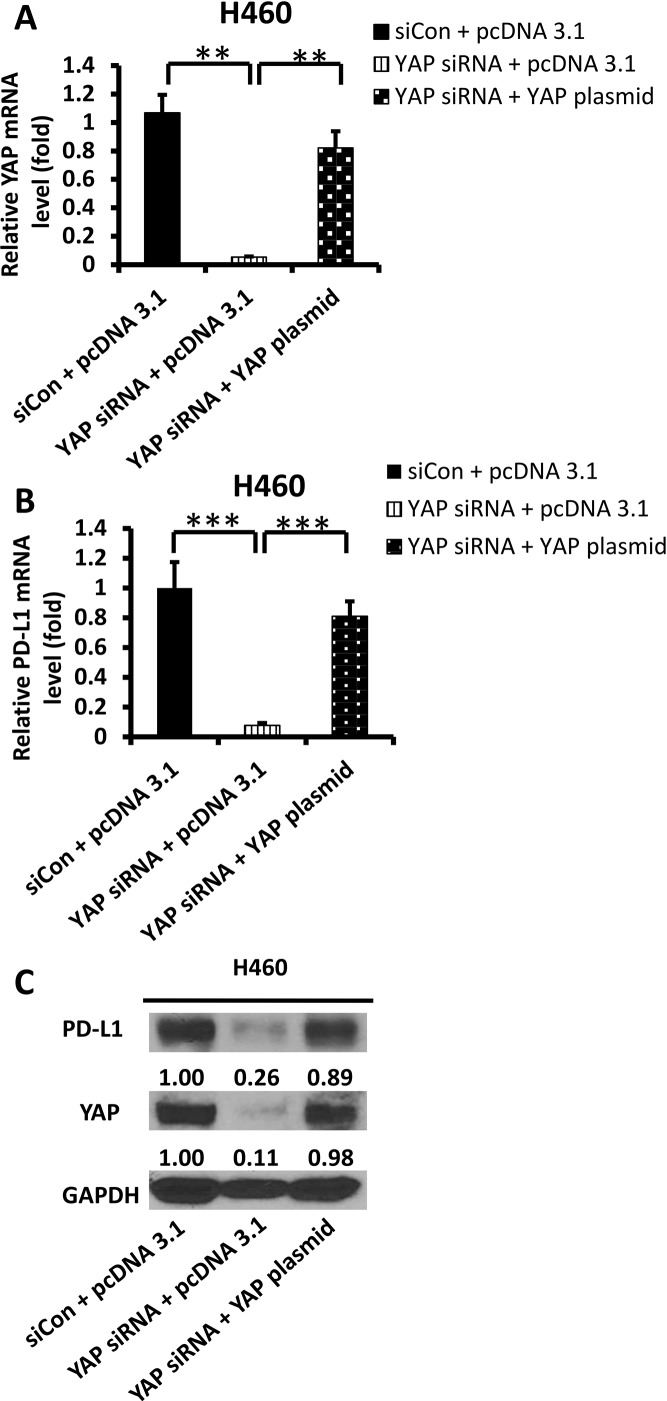
Figure 4. Expression of PD-L1 and YAP after YAP forced over-expression in siRNA-YAP H460 cells.
(A–B) qRT-PCR analysis of mRNA levels of YAP and PD-L1 after YAP silencing by siRNA and/or forced over-expression of the YAP gene in H460 cells. (C) Western blot analysis of YAP, PD-L1 after YAP silencing by siRNA and/or forced over-expression of the YAP gene in H460 cells. GAPDH was detected as a loading control. Band intensity was analyzed with ImageJ software and normalized with the intensity of GAPDH band. *P < 0.05, **P ≤ 0.01, ***P ≤ 0.001.

