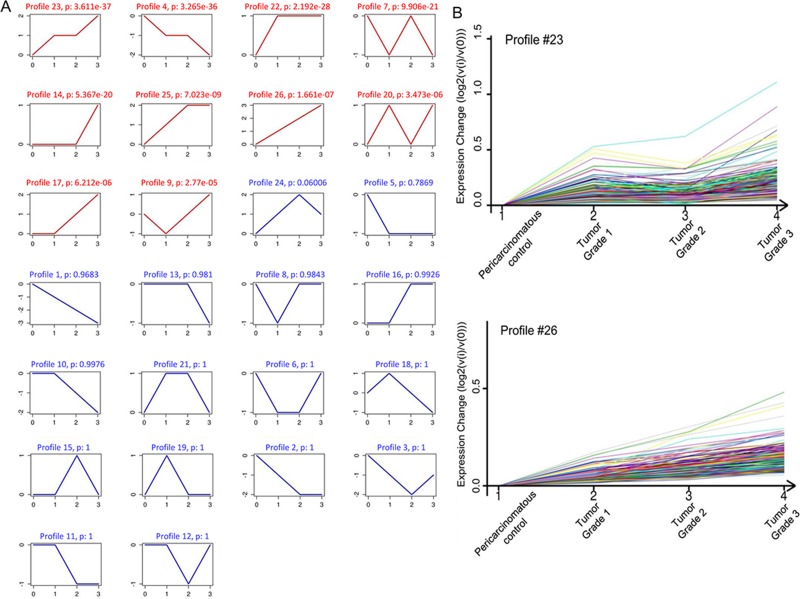
Figure 4. STC analysis for differential genes related to tumor grade.
(A) The expression patterns of genes were analyzed and 26 model profiles were used to summarize. Each box represents a model expression profile. Each image corresponds to a different model grade expression profile. The upper number in the profile box is the model profile number and the P value. The horizontal axis represents group points, and the vertical axis shows the gene expression levels for the gene after Log normalized transformation. (B) Two expression patterns of genes showed significant P values (P < 0.001). The number of genes assigned to each model profile is used as the estimate of the number of co-expressed genes.

