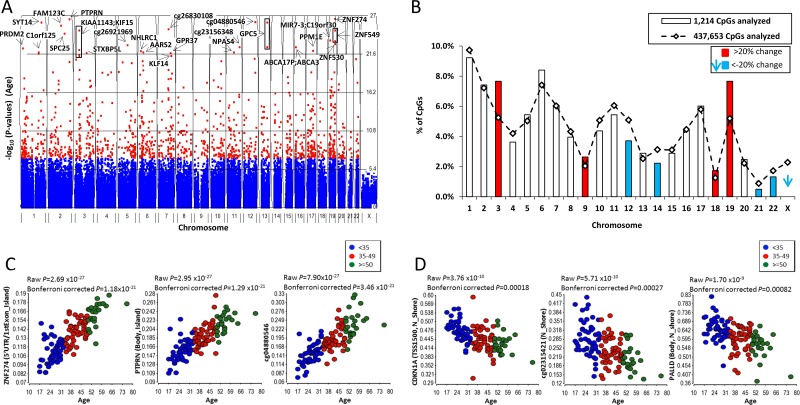
Figure 1. Age-related DNA methylation.
(A) Manhattan plot showing aDNAm’s identified in normal breast tissues (n = 121). The significance −log10 (P-value) of the associations of DNA methylation with aging by chromosomes is shown. Each dot indicates each CpG. Red and blue dots reporesent Bonferroni corrected P-value < 0.05 and > 0.05, respectively. The top 30 aDNAm’s are indicated with an arrow and gene name. If there were no corresponding gene to aDNAm’s, a target ID (Illumina array) is shown. A box shows multiple aDNAm’s corresponding to one gene. (B) Comparison of the proportion of expected (line) and observed (box) aDNAm’s by chromosome. An expected % was calculated based on a total 437,653 CpGs analyzed on the array and the observed % was calculated among 1,214 aDNAm’s at Bonferroni corrected P < 0.05. Chromosomes in red and blue are those substantialy (20%) higher or lower than expected, respectively. Dot plots of beta-values for top 3 aDNAm’s for gain (C) and loss (D) of methylation based on the p-value. Each point represents the beta-value for an individual (n = 121). Three age groups are colored for < 35 (blue), 35–49 (red), and > = 50 (green) for visualization. The raw and bonferroni corrected P-value for the association of DNA methylation with age are shown.

