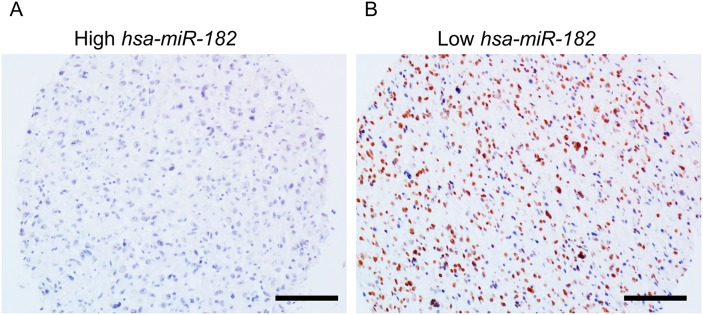
Figure 2. PPP1R1C and miR-182 are inversely correlated in patients with GBM.
Representative immunohistochemistry images showing PPP1R1C expression in glioblastoma tissue with differential expression levels of miR-182 expression as determined by qRT-PCR. Brown staining represents positive PPP1R1C expression. Scale bar – 40 μm.

