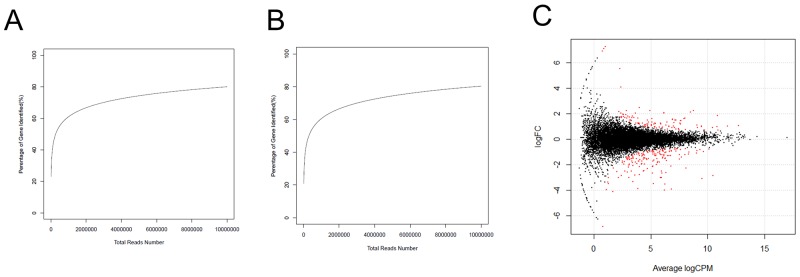
Figure 2. Identification of DEGs between H and L groups.
(A) The test of RNA-Seq saturation in the H group. (B) The test of RNA-Seq saturation in the L group. (C) Expression scatter plot of the DEGs between H and L groups. Red dot represents a gene with fold change ≥ 1.5 and P-value ≤ 0.05. X-axis values are average log2 (counts per million) and y-axis values are log2 (fold change).

