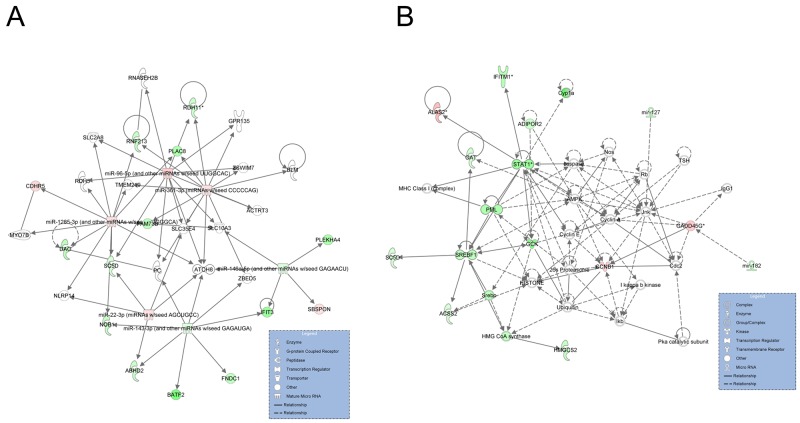
Figure 7. Graphical representation networks generated by IPA related to lipid metabolism.
(A) Network 1 (direct, score 32). (B) Network 2 (direct, score 23). Node shapes indicate the biological function of the genes and gene products, and the relationship among these is represented as a line. Node colors indicate gene expression: green indicate down-regulated and red indicates upregulated expression when comparing the H to L groups.

