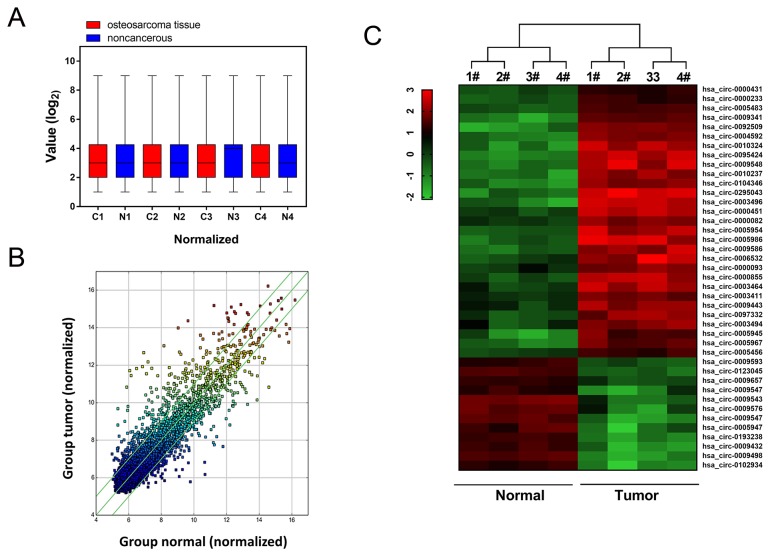
Figure 1. Circular RNA microarray expression profiles of osteosarcoma tissue and adjacent normal tissue.
(A) Box plot revealed the normalized intensities of 4 pairs of osteosarcoma tissue and adjacent normal tissue samples. (B) Scatter plot was performed to present the dysregulated circRNAs between osteosarcoma tissues and adjacent noncancerous tissues. (C) Heat map and hierarchical cluster analysis showed the circular RNAs expression in 4 pairs of osteosarcoma tissue and adjacent normal tissue.

