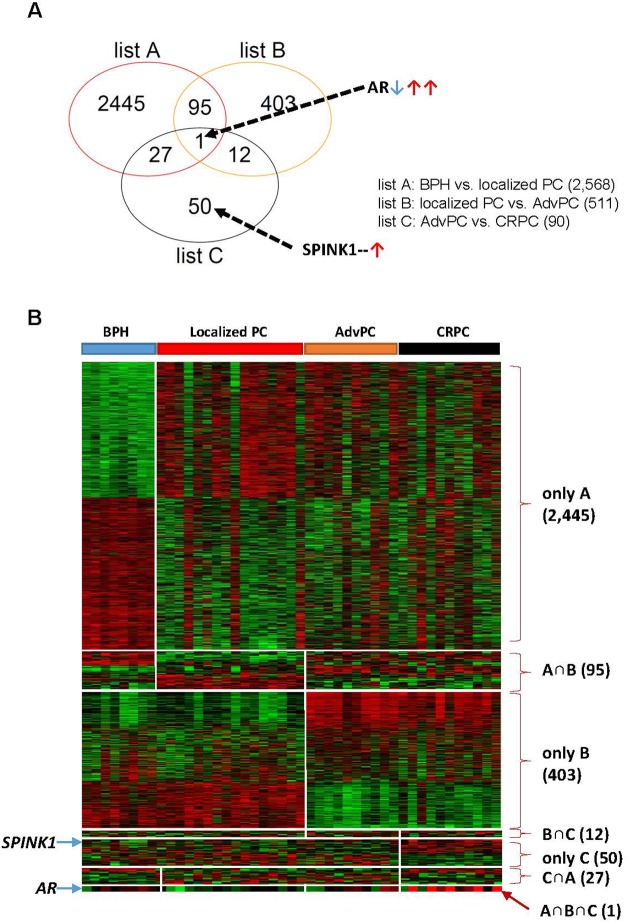
Figure 1. Differentially expressed genes in the prostate tissue samples from the next-generation sequencing (NGS) cohort.
The NGS cohort consisted of patients with benign prostate hyperplasia (BPH), localized prostate cancer (PC), advanced PC (AdvPC), or castration-resistant PC (CRPC). (A) Venn diagram of the genes that were differentially expressed in the BPH, localized PC, AdvPC, and CRPC patients. The genes were selected by using the GLM likelihood ratio test with EdgeR software. Genes whose differential expression was ≥2-fold and significant (P>0.001) were selected. Genes in the red circle (list A) indicate those that are differentially expressed between BPH and localized PC. Genes in the orange circle (list B) indicate those that are differentially expressed between localized PC and AdvPC. Genes in the black circle (list C) indicate those that are differentially expressed between AdvPC and CRPC. (B) Expression patterns of selected genes in the Venn diagram. The data are presented in matrix format where rows indicate individual genes and columns show the indicated tissue. Red and green colors indicate high and low expression, respectively.

