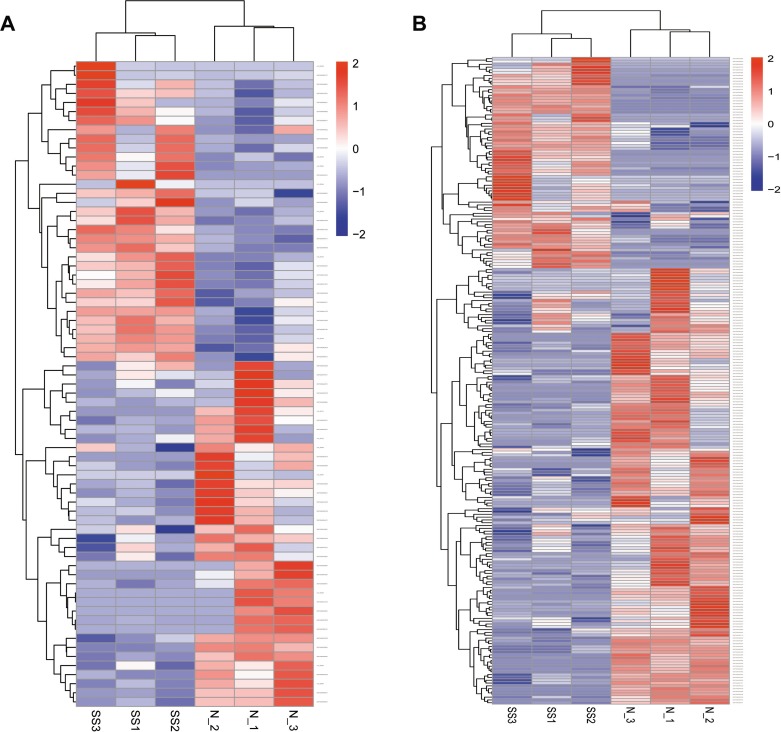
Figure 3. Hierarchical heat maps of the differentially expressed profiles between sensitive and normal skin.
lncRNA (A) and mRNA (B) were used for analysis of the gene expression data, for which the cluster analysis arranges samples into groups according to their expression levels. Each column represents a sample and each row represents a transcript. ‘Red’ indicates higher expression, and ‘blue’ indicates lower expression. Sensitive skin (SS), normal skin (N).

