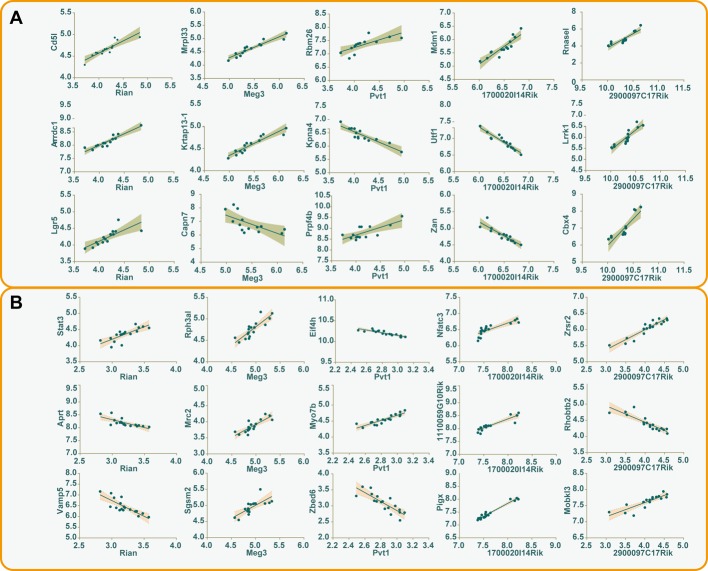
Figure 4. The correlations between differentially expressed lncRNAs and trans-regulatory genes.
The first three trans-regulatory genes along with their corresponding differentially expressed lncRNAs were used to construct correlative plots, and the 95% confidence intervals of every correlation were shown in the shadow of different colors (A) macrophage, gray; (B) liver, pink.

