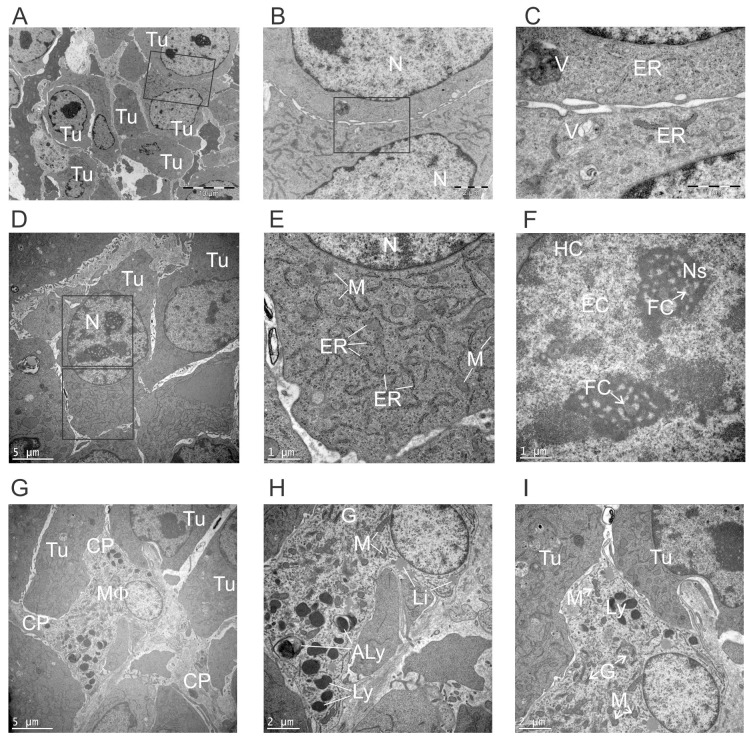
Figure 4. Ultrastructural appearance of non-treated tumors.
Subcutaneous E0771-Her2 tumors were taken 14 days after injection, and analysed using transmission electron microscopy. Representative fields depicting tumor cells (A-F) and macrophages (G-I) are presented. (B) High power view of boxed region in A. (C) High power view of boxed region in B. (E, F) Higher power view of boxed regions in D. (Tu, tumor cell; N, nucleus; ER, endoplasmic reticulum; V, vesicle; M, mitochondria; HC, heterochromatic; EC, euchromatin; FC, fibrillary centers; Ns, nucleolus; MF, macrophage; CP, cytoplasmic process; G, golgi; Ly, lysosome; Aly, autolysosome; Li, lipid droplet.

