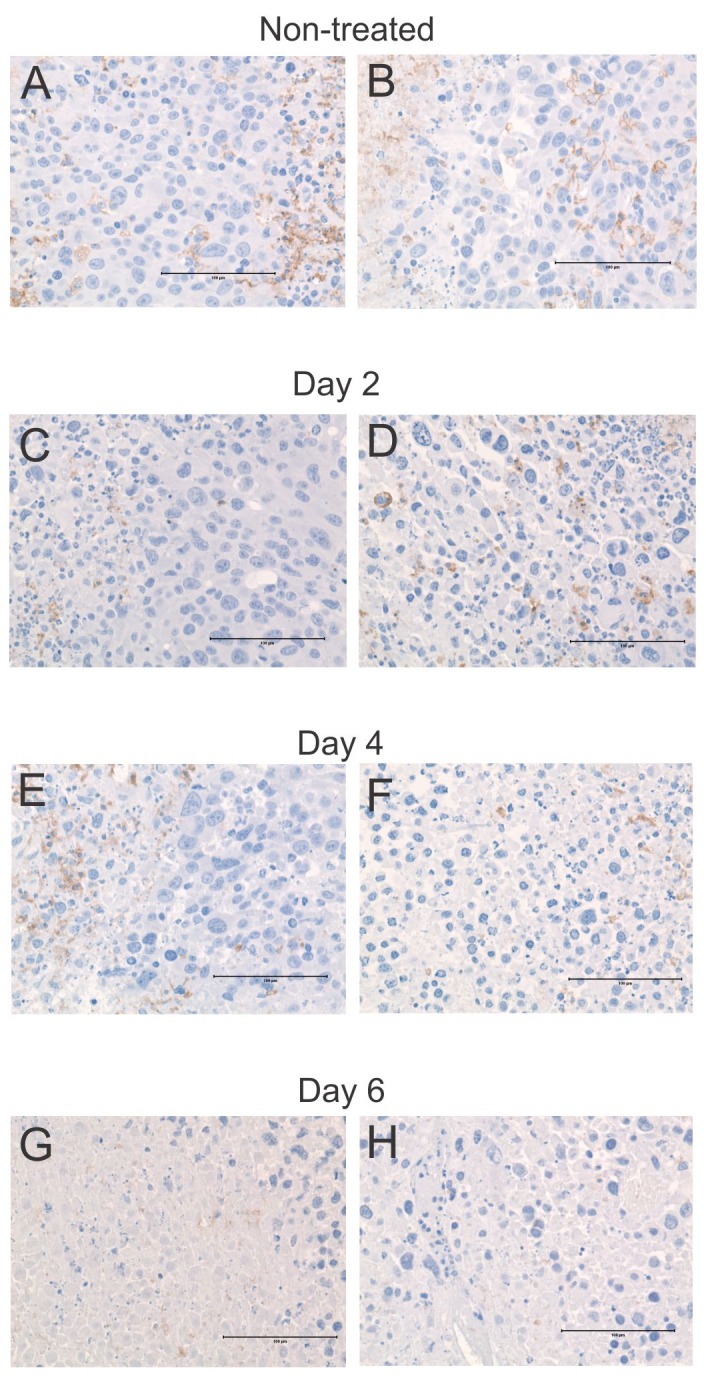
Figure 8. Frequency and distribution of macrophages in tumors following ACTIV therapy.

Representative sections of tumors were taken from mice following (A-B) no treatment, (C-D) 2 days after treatment, (E-F) 4 days after treatment, (G-H) 6 days after treatment, and stained with an antibody specific for the macrophage marker F4/80. Brown stain = F4/80, blue = hematoxylin. Size bar = 100 μm.
