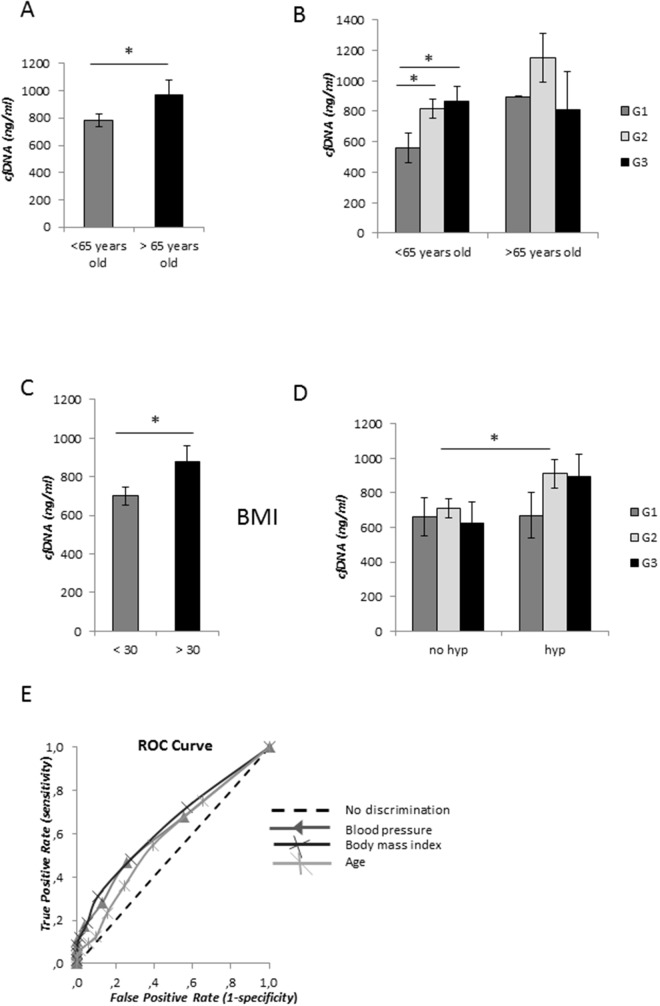
Figure 2. cfDNA concentration levels and metabolic syndrome components.
(A) Average of cfDNA content in patients younger and older than 65 years old. (B) Correlation of age with EC grading. (C) CfDNA content association with body mass index (BMI) <30 and > 30. (D) Correlation analysis of cfDNA amount in serum samples from non-hypertensive (no hyp) and hypertensive (hyp) EC patients. Statistical significance: *P≤0.05, **P≤0.01, ***P≤0.001. Data are represented as mean +/− standard error (SEM). The error bars indicate the standard error. (E) Receiver operative characteristics (ROC) curves for cfDNA levels discriminating between hypertensive and non- hypertensive patients, patients with BMI ≥ 30 and with BMI < 30, and aged ≥65 and aged < 65 years.

