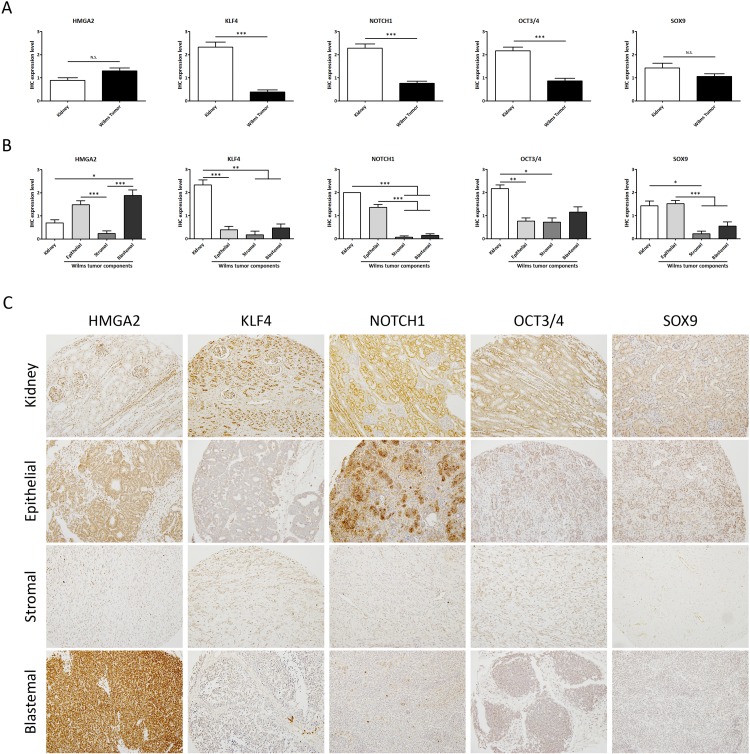
Figure 1. Analysis of the expression levels of embryonic stem cell markers showed differences between normal kidneys and WT samples.
(A) Expression analyses of 13 kidneys versus 70 WT samples (regardless of subcomponents conformation) by tissue microarray. (B) Differential embryonic stem cell expression in the epithelial, stromal, and blastemal WT components. (C) Representative immunohistochemical detection of embryonic stem cell markers in different WT components from tissue microarray (20X magnification). For all ANOVA analyses, * p<0.05; ** p<0.01; *** p<0.001. NS, not significant.

