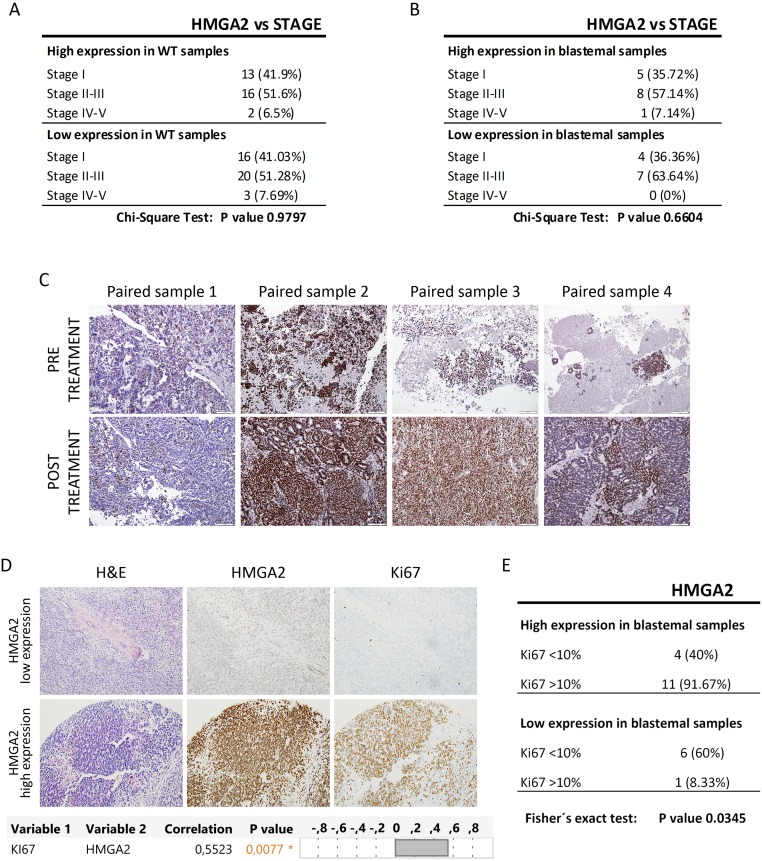
Figure 3. The expression of HMGA2 did not correlate with tumor stage and SIOP-treatment protocol, but correlated with Ki-67 expression.
(A) Relation between HMGA2 expression and stage in all WT subtypes. (B) No significant relationship between high and low expression of HMGA2 and stage in blastemal WT component. (C) Similar HMGA2 expression between pre- and post-treatment paired WT samples by immunohistochemistry. (D) Immunohistochemical detection and significant positive correlation between HMGA2 and Ki-67 in blastemal WT components (20X magnification) (upper panel). Correlation analyses between HMGA2 and Ki-67 (lower panel). (E) Significant relationship between high and low expression of HMGA2 and Ki-67 in blastemal WT component.

