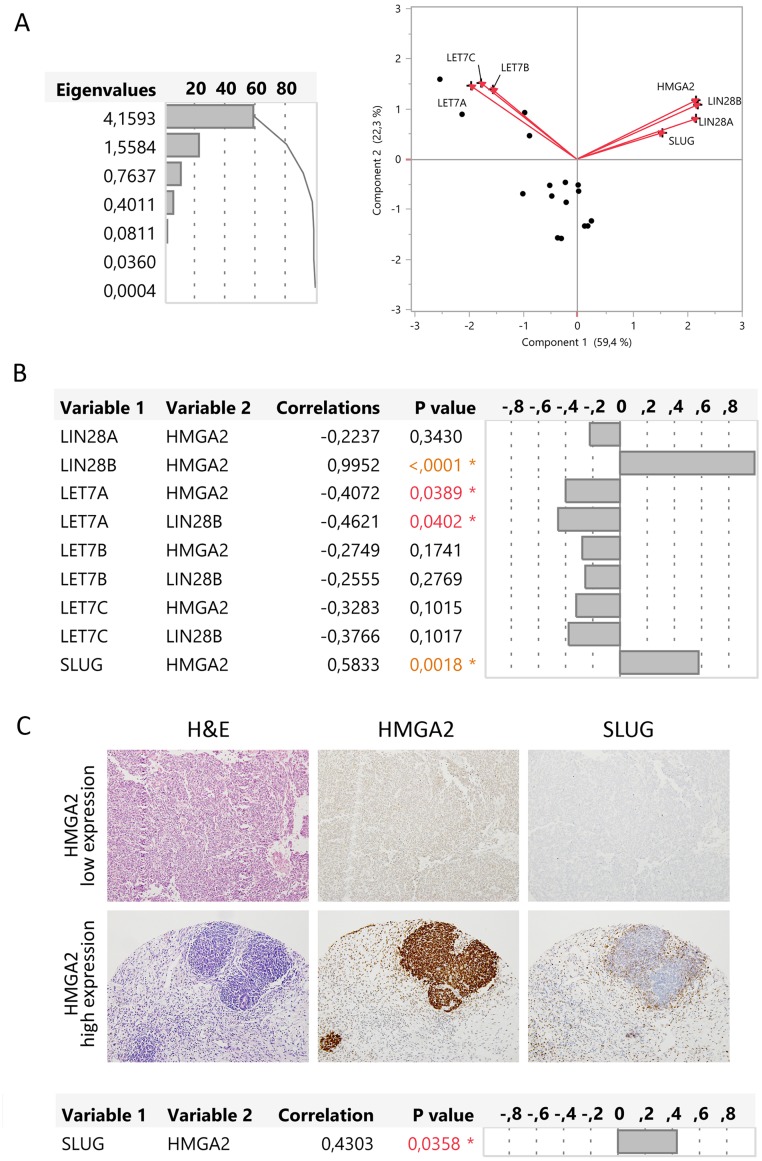
Figure 4. HMGA2 correlated with LIN28B, LET-7A, and SLUG gene expression in the blastemal WT component.
(A) Principal component analysis represented by biplot showed the possible relations between genes. (B) Multivariate correlations between the expression of HMGA2, LIN28A, LIN28B, LET7A, LET7B, LET7C, and SLUG genes. (C) Immunohistochemical correlation between HMGA2 and SLUG in two blastemal WT components from tissue microarray (20X magnification).

