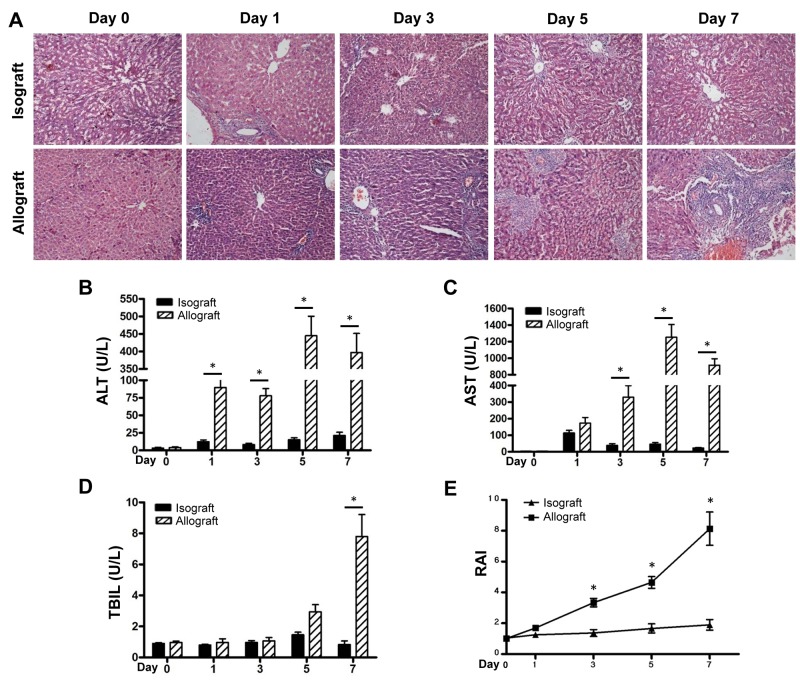
Figure 1. AR responses in the isograft and allograft groups.
Recipient rats in the isograft group (BN-to-LEW) and the allograft group (LEW-to-BN) were sacrificed before or after liver transplantation at days1, 3, 5 and 7 (5 rats at each time point for each group). Morphology of the transplanted mouse liver was observed by HE staining (A). Plasma ALT levels (B), AST levels (C) and TBIL levels (D) were detected at the indicated times. Histological classification was analyzed by RAI according to Banff’s scheme (E). *p<0.05.

