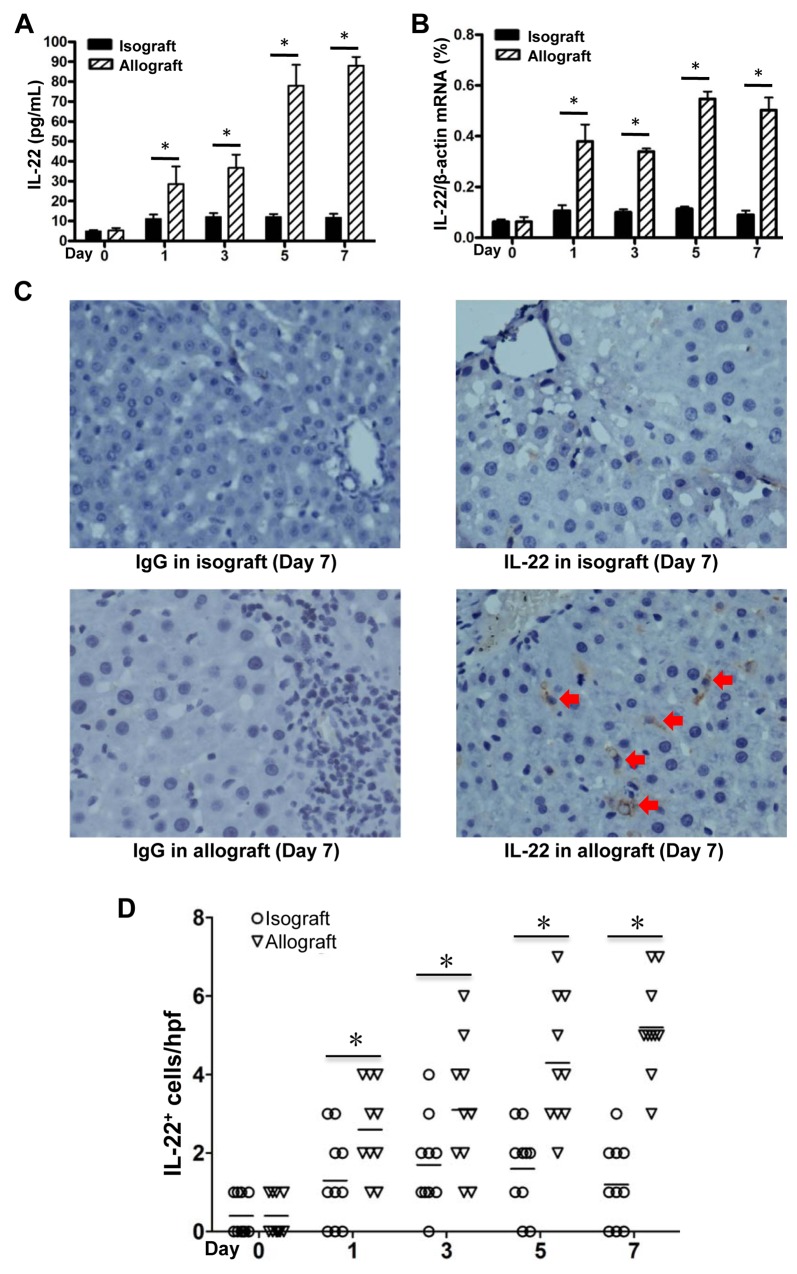
Figure 2. IL-22 expression in allogeneic and isogenic liver transplant tissues.
IL-22 concentrations in plasma (A) and IL-22 mRNA levels in liver tissues (B) of recipients (n=5) in the isograft group and the allograft group before or at the 1, 3, 5 and 7 days after liver transplantation. (C) IHC assay for IL-22 expression in liver tissues of recipients in the allograft and isograft groups at 7 days postoperatively, with isotype IgG as control staining. Positive cells were indicated by red arrows. (D) Statistical analysis of liver portal areas IL-22+ cell counts in IHC staining tissues. Five different high power fields (hpf) (400 ×) of liver portal areas were used for counting positive cells by two independent observers. * p<0.05.

