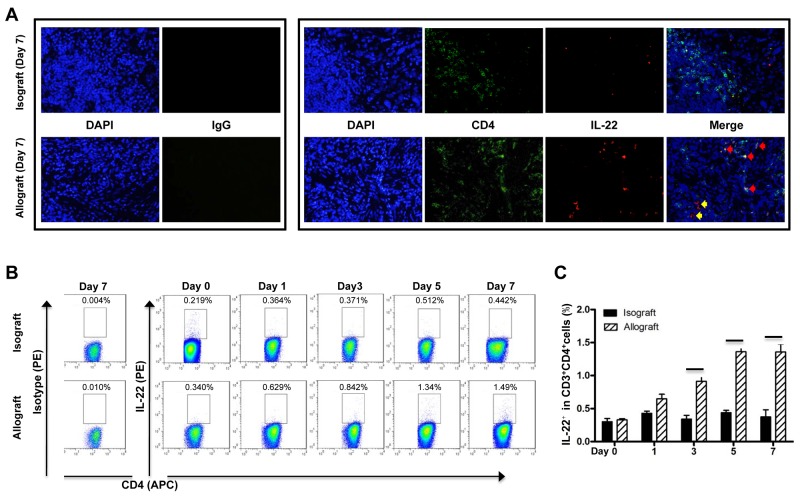
Figure 3. Cellular source of IL-22 in liver transplantation.
(A) Representative IF staining of IL-22 and CD4 in liver tissues of the allograft group at 7 days postoperatively (n=5). The representative CD4 and IL-22 double positive cells and IL-22 positive cells were indicated by red arrows and yellow arrows, respectively. (B and C) Flow cytometry assay of IL-22 expression. Liver lymphocyte from rats of the isograft group (n=5) and allograft group (n=5) at the indicated times after liver transplantation were in vitro stimulated with PMA and ionomycin. After CD3 gating, the frequency of CD4 and IL-22 positive cells was analyzed by flow cytometry. The representative flow cytometry results (B) and the statistical results (C) are shown. *p<0.05.

