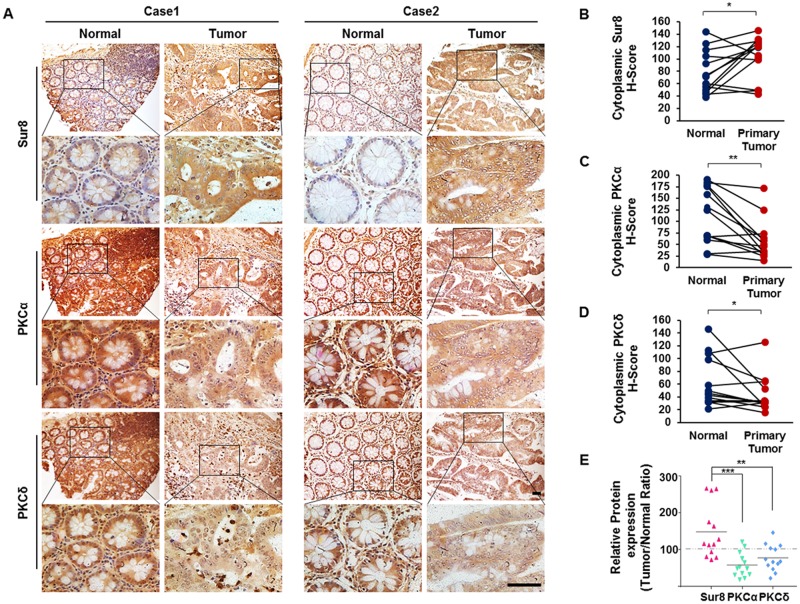
Figure 6. Expression of Sur8, PKCα, and PKCδ protein in human colorectal normal vs. tumor paired tissues.
(A) Normal (left panels) and tumor (right panels) colorectal tissues fixed on TMA slides were analyzed by DAB staining using Sur8 (top panels), PKCα (middle panels), and PKCδ (bottom panels) antibodies. Representative images are shown at 200× (upper) and 600× (lower) magnifications. Scale bars, 200 μm. (B-D) Quantitative analysis of Sur8 (B), PKCα (C), and PKCδ (D) was performed by comparing patient-matched adjacent normal (n = 13) colorectal tissue with tumor (n = 26) tissue based on H-Score. (E) Graphical image showing the inverse correlation between Sur8 and PKCα/δ expression of 13 sets of human colorectal adjacent normal and tumor tissues. All values were calculated using student’s t-test. *P < 0.05, **P < 0.01, ***P < 0.001.

