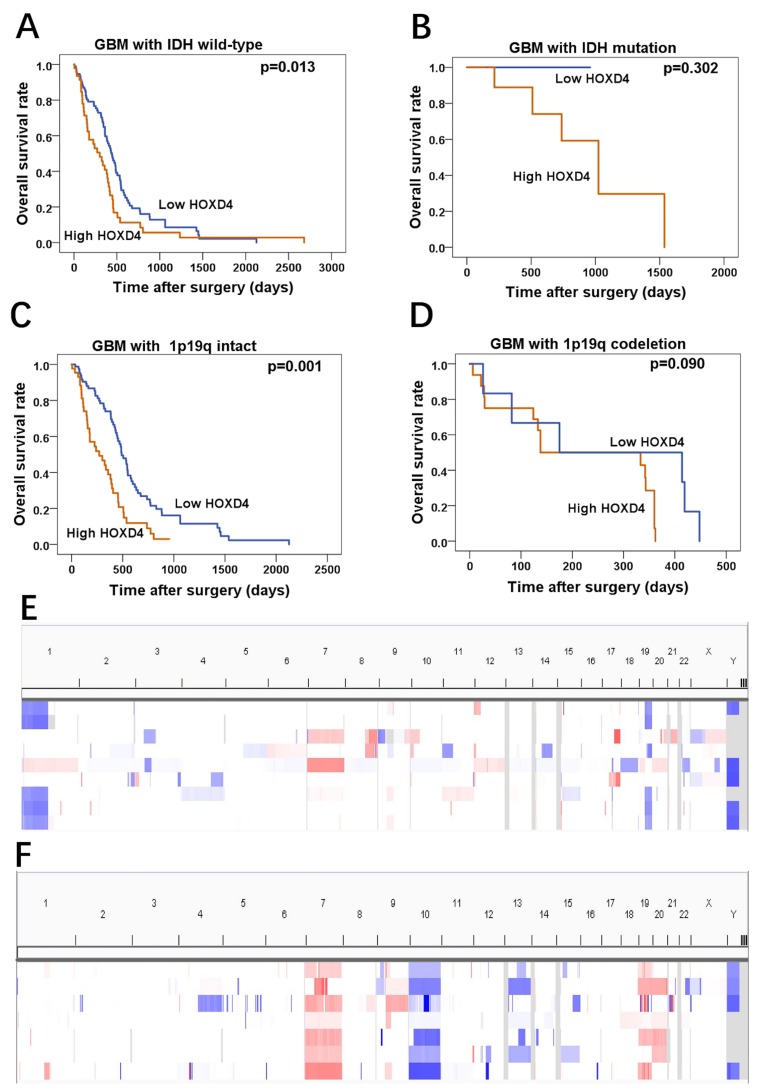
Figure 4. HOXD4 expression impact the OS of GBM patients with IDH wild-type or 1p19q intact by TCGA data analysis.
(A-B) Prognosis of GBM with IDH wild-type was associated with HOXD4 expression (p=0.013), but prognosis of GBM with IDH mutation was not significantly associated with HOXD4 expression (p=0.302). (C-D) Prognosis of GBM with 1p19q intact was associated with HOXD4 expression (p=0.001), but prognosis of GBM with 1p19q codeletion was not significantly associated with HOXD4 expression (p=0.090). (E-F)Analysis of Copy Number Variations (CNVs) in LGG and GBM samples from TCGA, respectively. Rows represent glioma patients and columns represent chromosomes. The colors in the heatmap indicate allelic states: white =normal heterozygous state; light red =imbalanced gain; Dark red =amplified heterozygous states; Light blue = copy neutral LOH and amplified LOH; Dark blue = LOH or physical loss in the context of a diploid genome.

