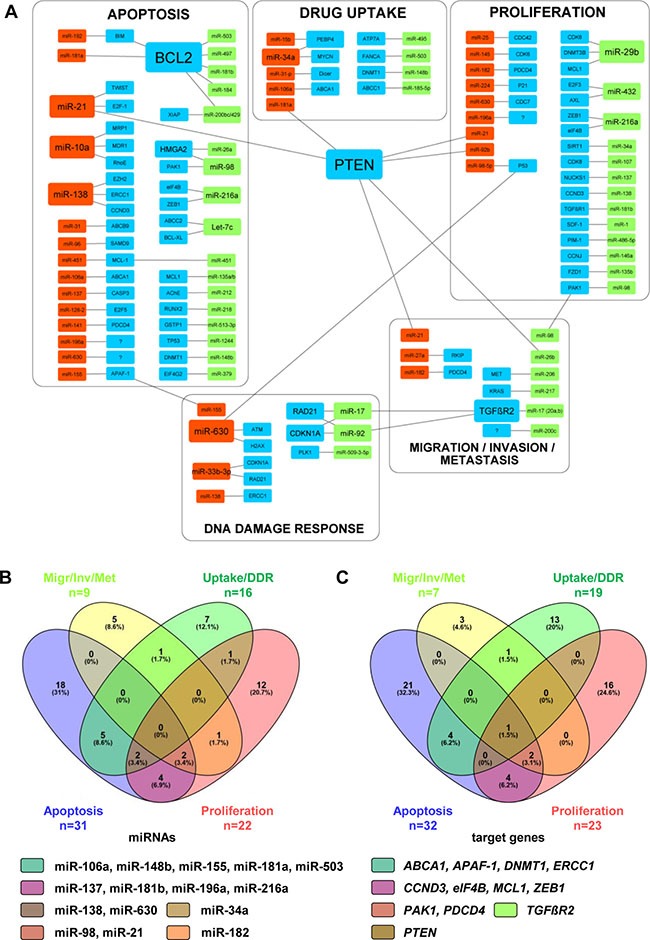
Figure 1. Correlations between miRNAs involved in resistance of NSCLC cells to CDDP.

(A) Different miRNAs and their target genes listed in Tables 1-3 were graphically put in correlation by using the Cytoscape software (ver. 3.4.0). Size of rectangular shapes correlates to the number of interactions between miRNAs and target genes. Red, up-regulated miRNAs; green, down-regulated miRNAs; blue, target genes. (B, C) Venn diagrams showing correlations between the miRNAs (n = 78) within particular pathways (B) and between target genes (n = 81) assigned to particular pathways (C). All MiRNAs and target genes shown in Venn diagrams are named in particular subgroups shown in Figure 1A. Venn diagrams were generated by publically available Venny-tool (http://bioinfogp.cnb.csic.es/tools/venny/). The group Apoptosis is shown in violet, group Proliferation in pink, group Migration/Invasion/Metastasis (Migr/Inv/Met) in yellow, and group Drug uptake/DNA repair (Uptake/DDR) in green. For each particular subgroup, the number and percentage of miRNAs or target genes are indicated. MiRNAs and target genes detected as multiplayers in different cell processes are listed accordingly to the color code of Venn diagrams.
