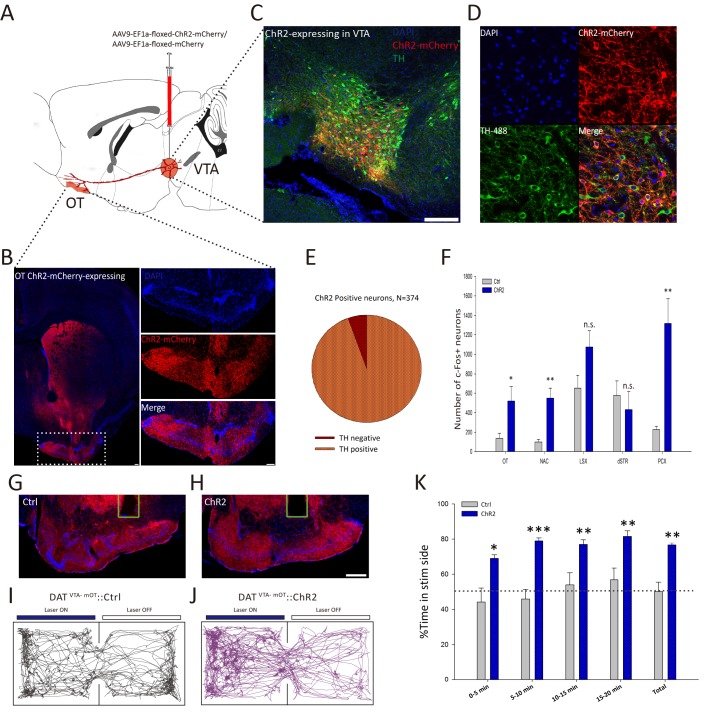
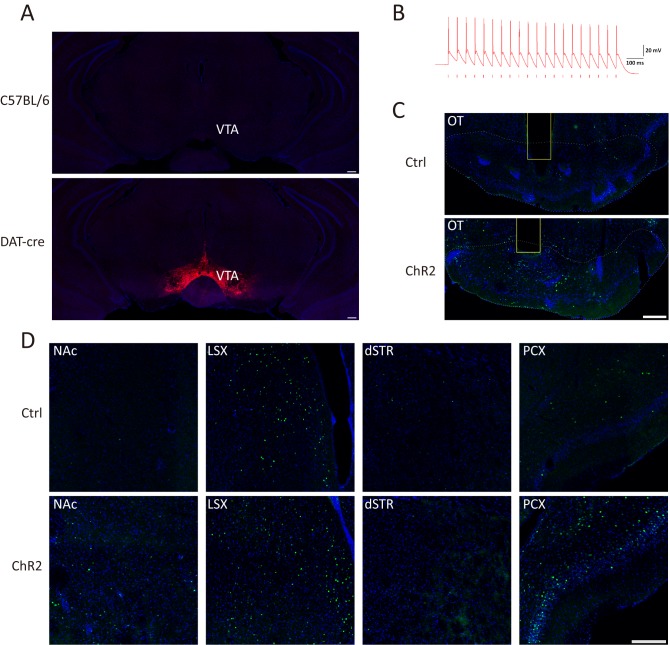
Figure 3. Activation of the VTA-mOT DAergic projection produced acute place preference.
(A) Schematic for virus injection to manipulate the VTA-mOT DAergic projections. AAV9-EF1a-floxed-ChR2-mCherry or the AAV9-EF1a-floxed-mCherry was unilaterally injected into the VTA of DAT-Cre mice. (B) ChR2-mCherry positive axons were densely distributed in the mOT. (C, D) Co-localization of the TH with ChR2-mCherry in the VTA neurons. (E) Statistical chart showed that ChR2-mCherry was relatively restricted to TH-positive neurons (n = 3). (F) Blue light stimulation of the VTA-mOT DAergic projections increased the c-fos expression levels in the OT, NAc, and PCX, while the c-fos expression levels in the LSX and dSTR had no significant changes (n.s., p>0.05). (G, H) Optical fibers were implanted in the mOT of control or ChR2-expressing mice. (I, J) Representative real-time place preference (RTPP) tracks illustrated light-evoked behavioral preference in ChR2-expressing mice (right, n = 7), but not in control mice (left, n = 7). (K) ChR2-expressing mice showed a significant preference for light stimulation chamber compared with control mice in the RTPP test. *p<0.05, **p<0.01, ***p<0.001. Scale bar: 200 μm.


