
Figure 3. The CENP-N:CENP-ANCP complex.
(A) Cartoon model of the CENP-ANCP with bound CENP-N1-235, determined by cryo-EM. (B) Surface representation of the complex. In A and B, the L1 loop of CENP-A is displayed in red. (C) Comparison of the DNA ends in the crystal structure of the CENP-A nucleosome (Tachiwana et al., 2011) and in the structure of the CENP-A:CENP-N complex. (D) Electrostatic potential at the CENP-N DNA binding interface with contour levels ± 4 kBT/e (kB, Boltzmann constant; T, absolute temperature; e, the magnitude of electron charge, calculated with the APBS Pymol plugin). (E) Interaction of CENP-N with backbone, minor groove, and major groove of DNA with close-up views of selected interactions. (F) Interactions at the CENP-A L1 loop and comparison with superimposed H3.

Figure 3—figure supplement 1. Additional EM data and analysis.

Figure 3—figure supplement 2. EM maps.

Figure 3—figure supplement 3. EMSA assays.

Figure 3—figure supplement 4. Essential features of CENP-A.

Figure 3—figure supplement 5. Comparison of CENP-A and H3 and interface with CENP-N.
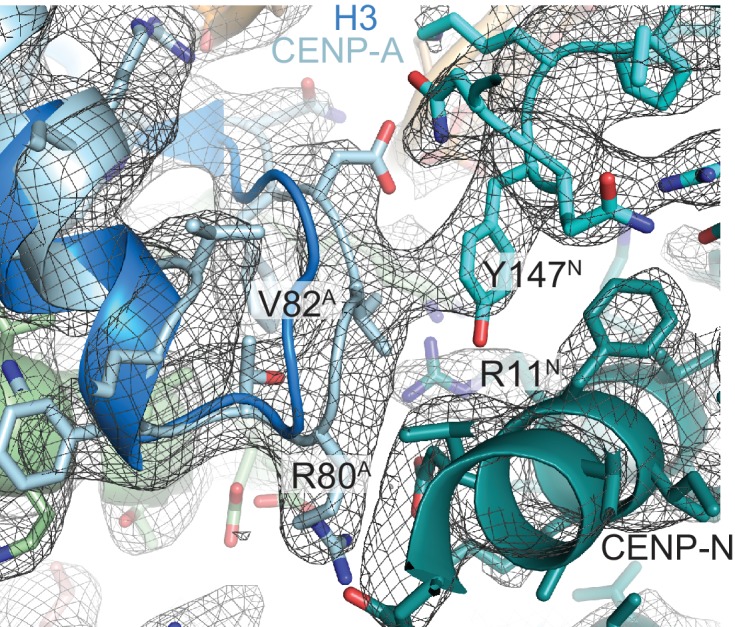
Figure 3—figure supplement 6. Comparison of nucleosome binding modes.
