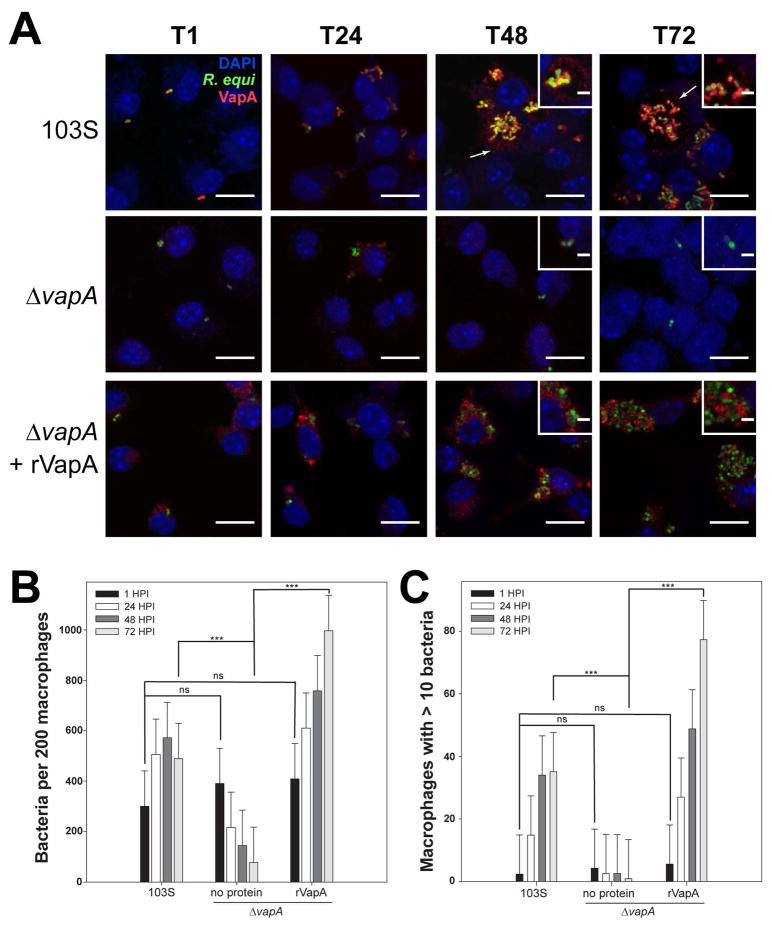
Figure 3. VapA associates with the RCV membrane during infection.
Murine bone marrow-derived macrophages (BMDMs) were infected with R. equi 103S or ΔvapA strains harboring the GFP expression plasmid, pGFPmut2. Where indicated, 100 nM rVapA was added to the BMDM monolayer the night before the infection. R. equi (GFP, green), BMDM nucleus (DAPI, blue), and VapA (anti-VapA, red) were observed. (A) Representative confocal images of infection, bar = 5 μ, inset bar = 1 μ. Arrows indicate VapA detected at the RCV membrane. (B) Bacterial numbers per 200 macrophages were quantified by direct visualization at the indicated time points. (C) Macrophages containing ten or more bacteria, discerned via direct visualization. (B,C) Bars indicate the mean number of quantified bacteria or macrophages, while the error bars represent the standard deviation calculated by a two-way ANOVA using the Holm-Sidak method. n = 3; ns = not significant and (***) = P ≤ 0.001.

