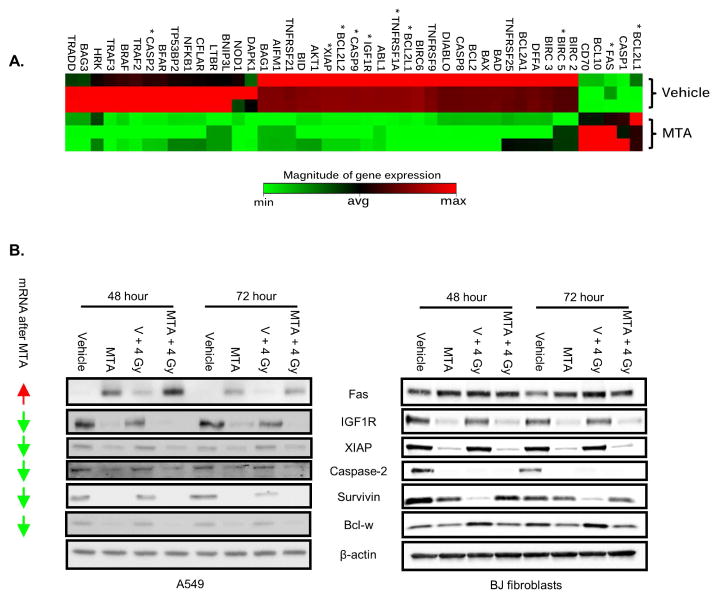
Figure 4. Gene expression profiling with MTA.
(A) A549 cells were treated with vehicle or MTA 24 h. Gene expression was determined by quantitative PCR. Differentially expressed genes are clustered based on common patterns between sample groups. Genes implicated in mitotic catastrophe are marked with a “*”. (B) A549 and BJ cells were treated with MTA for 1 h followed by IR. After 24 h media was replaced. Lysates were collected at 48 and 72 h after IR. Arrows: mRNA expression change with MTA treatment (up vs. down relative to vehicle).

