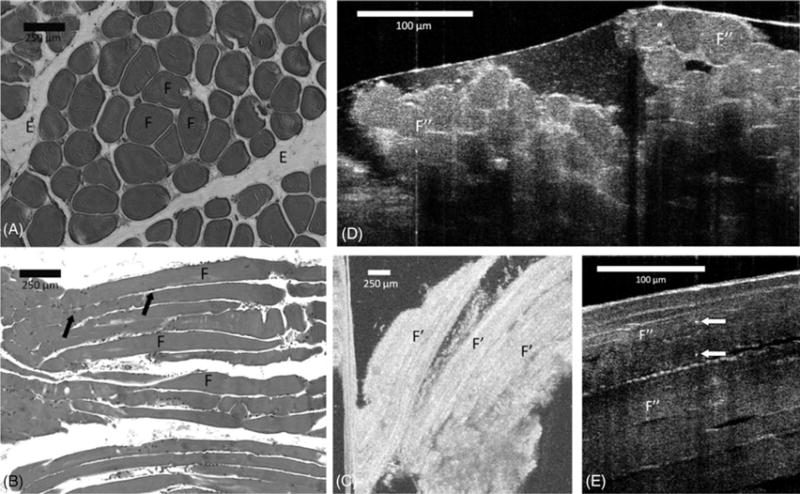
FIGURE 4.

Comparison between (A) transverse and (B) longitudinal section hematoxylin-eosin slides (original magnification ×100), (C) en face optical frequency domain imaging (OFDI), and cross-sectional μ-optical coherence tomography (μOCT) images of (D) transverse and (E) longitudinal view of muscle tissue. Skeletal muscle fibers occur in bundles (F), separated by endomysium (E). The myocyte nuclei are located peripherally within the bundle (arrows). In the OFDI image, the myocytes appear in the longitudinal view as elongated gray bands against a black background (F′). μOCT image demonstrates fascicles (F″) surrounded by endomysium. Bright dots that possibly represent nuclei (white arrows) can be recognized in the μOCT image.
