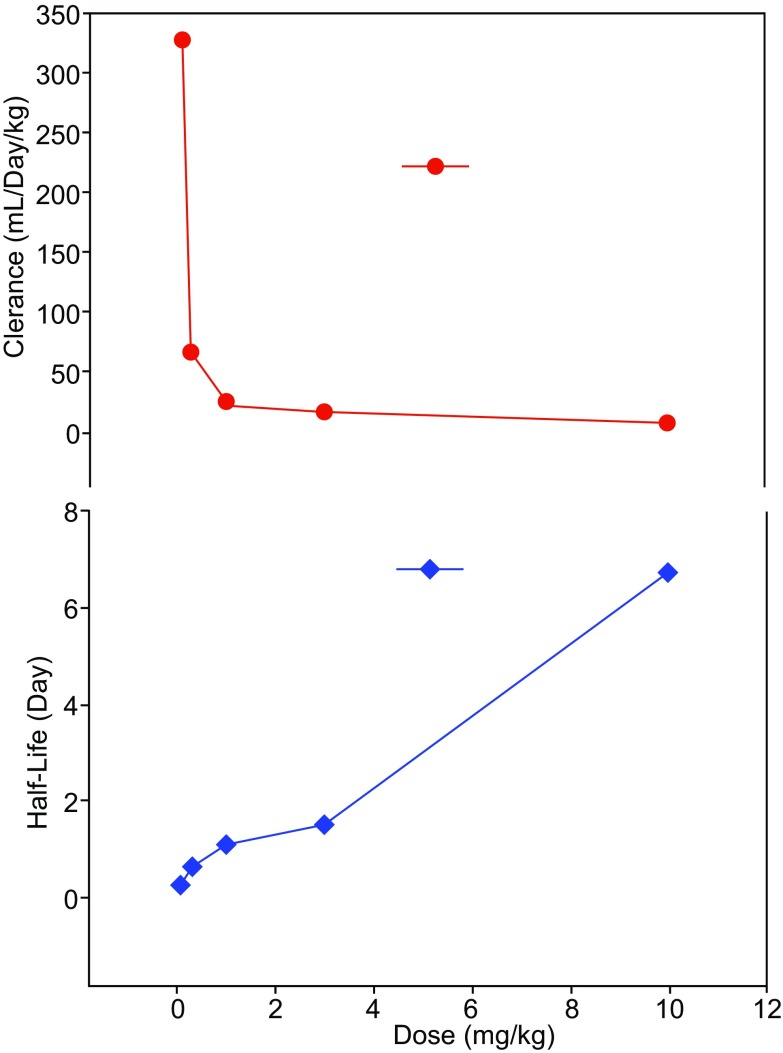
Figure 4.
A typical TMDD graph exhibiting the relationship between clearance or t1/2 and mAb dose. Anti-αv mAb was infused to cancer patients; clearance or terminal half-life (t1/2) was plotted against dose (0.1, 0.3, 1, 3, and 10 mg/kg). Adapted from Mullamitha et al., Clin Cancer Res. (2007)

