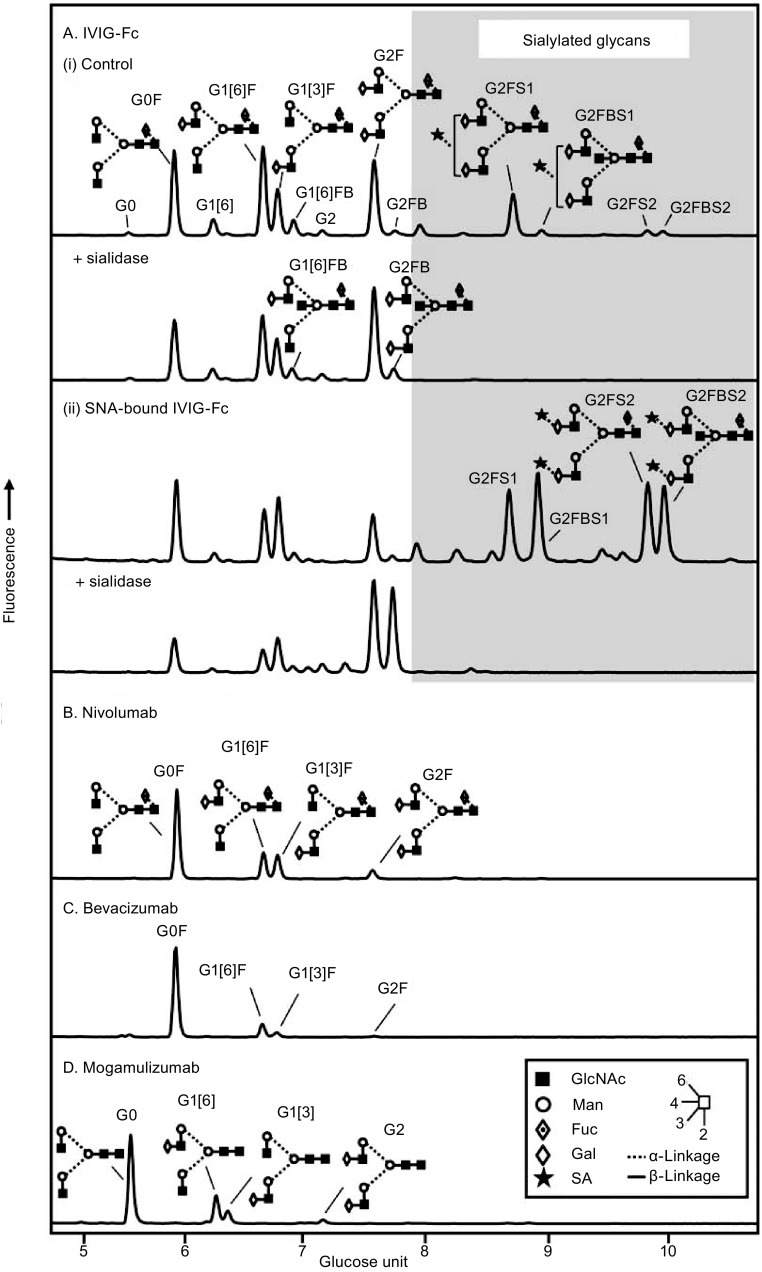
Figure 1.
Glycan profiles of therapeutic antibodies by hydrophilic interaction liquid chromatography (HILIC). The glycan profiles of the Fc of IVIG (A). The control IVIG-Fc (i) and the SNA-bound IVIG-Fc fraction (ii). The glycan profiles of therapeutic IgG monoclonal antibodies (B–D). (B) Nivolumab (human anti-PD-1 IgG4), (C) Bevacizumab (humanized anti-VEGF IgG1), (D) Mogamulizumab (humanized anti-CCR4 IgG1). The glycans were released with peptide-N-glycosidase F from the Fc fragments of IVIG and the heavy chains of the recombinant IgG antibodies in the SDS-PAGE gel bands and labeled with 2-aminobenzamide as previously described (Royle et al., 2006). The fluorescently labeled glycans were separated by ultra-performance liquid chromatography (UPLC) on a sub-2 μm hydrophilic interaction based stationary phase with a Waters Ethylene Bridged Hybrid (BEH) Glycan chromatography column (150 × 2.1 mm i.d., 1.7 μm BEH particles) (Bones et al., 2010; Doherty et al., 2012). The glycan peaks were assigned in accordance with the previous study (Pucic et al., 2011). Glycans are designated by the letters G, F, S, and B indicating the presence of galactose, fucose, sialic acid, and bisecting GlcNAc, respectively. [3] and [6] in the G1 glycan codes indicate the attachment of galactose on the α(1-3)- and α(1-6)-arm, respectively. Symbols of monosaccharides and lines for showing glycosidic linkages (Inset)

